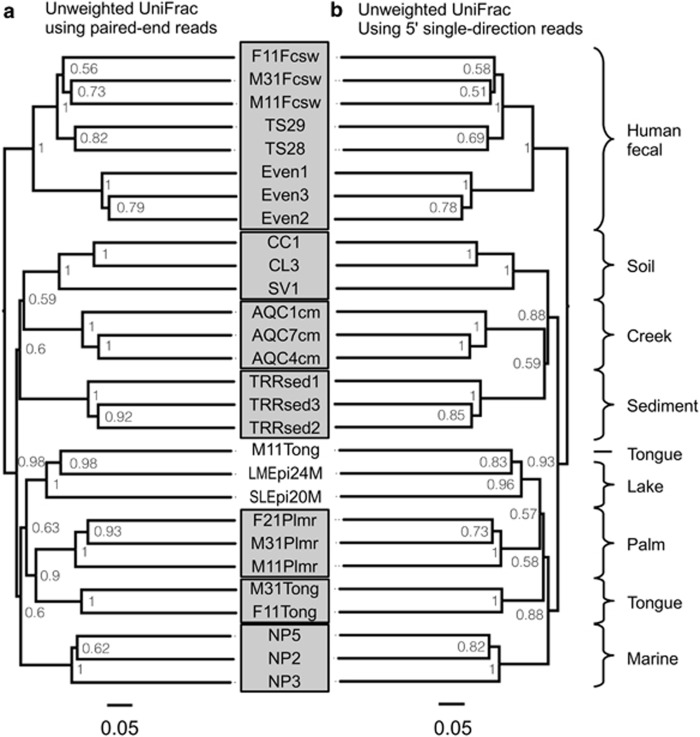
Figure 1.
Choice of PE or SD reads made no practical difference in phylogenetic clustering of samples: UPGMA tree of unweighted UniFrac distances between samples determined using the PE sequence data (a) as well as SD reads (b). Bootstrap values represent 100 rarefactions of 50 000 sequences per sample.

