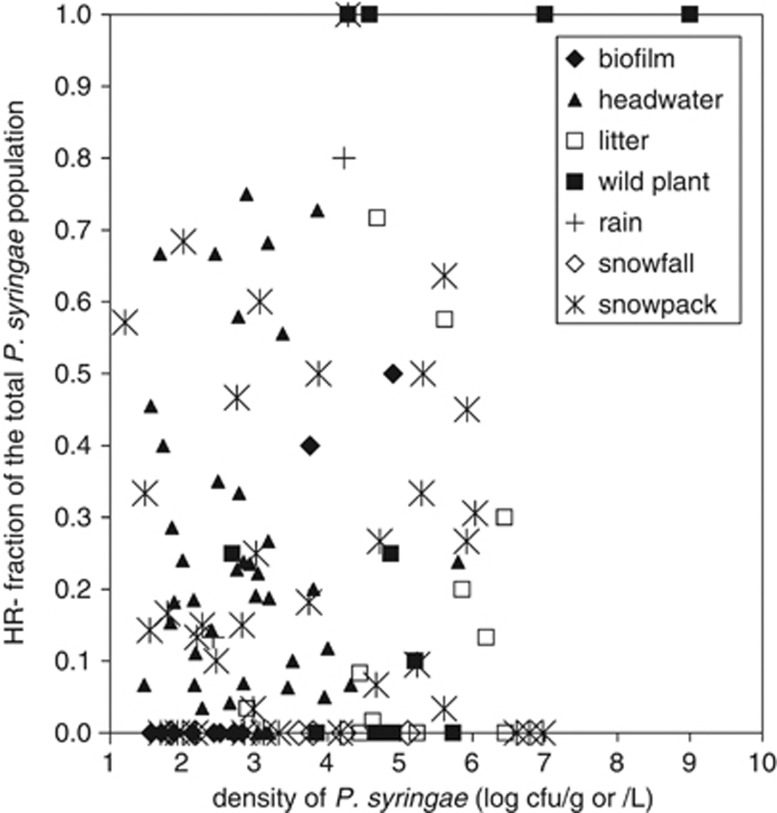
Figure 1.
Fraction of HR− strains in the total P. syringae populations in environmental samples in terms of the density of the P. syringae population in the sample. Population densities are expressed as log c.f.u. g−1 for biofilms, plant and leaf litter or log c.f.u. l−1 for water, rain and snow (as snowmelt). The data constitute values from 100 of the 126 samples described in Table 1. For these 100 samples, they were processed to permit quantification of the density of the HR− component population as well as that of the total P. syringae population.

