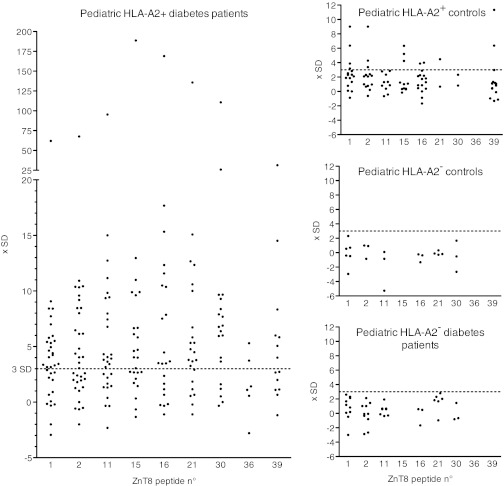
FIG. 2.
ELISpot responses of pediatric type 1 diabetic patients and control subjects to ZnT8 peptides. ELISpot results are represented as multiples of the SD for the individual assay after subtraction of the mean basal spot number measured in the presence of solvent; for example, a value of 10 indicates that the spot number corresponded to (basal mean for the patient tested) + 10 SD. Each dot corresponds to an individual result for the peptide indicated on the x-axis. See text for details on patient and control groups. Raw data are available in Supplementary Fig. 1.

