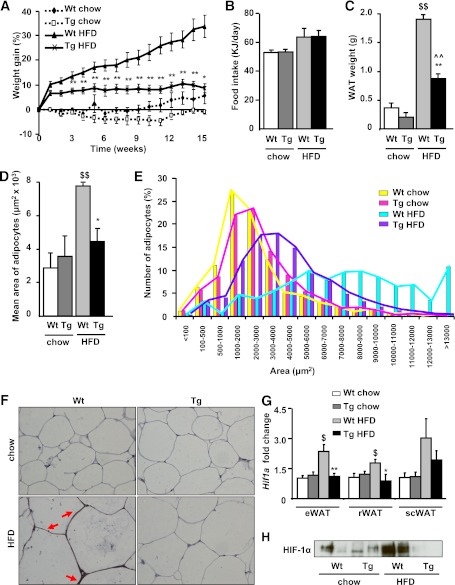
FIG. 2.
Reduced adiposity in aP2VEGF transgenic (Tg) mice fed an HFD. Weight gain (A) and food intake (B), calculated as estimated metabolisable energy of wild-type (Wt) and Tg mice fed chow or an HFD for 15 weeks. Data represent the mean ± SEM of at least 10 animals per group. C: Epididymal WAT weight. D: Mean adipocyte area. E: Frequency distribution of adipocyte area in Wt and Tg mice fed chow or an HFD. Data represent the mean ± SEM of at least four animals per group. F: Representative hypoxyprobe sections of epididymal WAT, counterstained with hematoxylin (original magnification ×400). Red arrows indicate hypoxyprobe signal. G: Hif1a expression was analyzed by quantitative real-time PCR in epididymal WAT (eWAT), retroperitoneal WAT (rWAT), and subcutaneous WAT (scWAT), and was normalized by 36B4 expression. Data represent the mean ± SEM of at least seven animals per group. H: Representative WAT Western blot blotted with an antibody against HIF-1α. *P < 0.05 vs. Wt HFD. **P < 0.01 vs. Wt HFD. $P < 0.05 vs. Wt chow. $$P < 0.01 vs. Wt chow. ^^P < 0.01 vs. Tg chow. (A high-quality digital representation of this figure is available in the online issue.)

