FIG. 3.
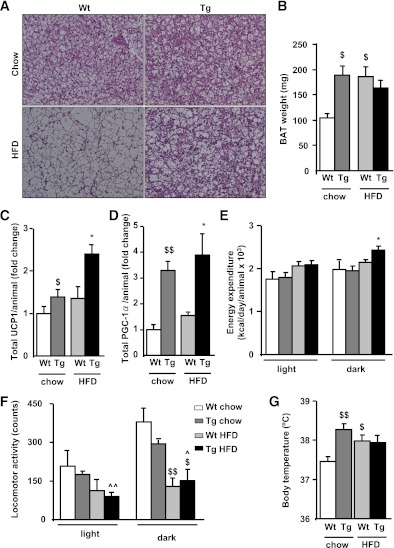
Transgenic (Tg) mice showed increased BAT thermogenesis and energy expenditure. A: Representative sections of BAT, stained with hematoxylin-eosin (original magnification ×200) for Tg and wild-type (Wt) mice. B: Interscapular BAT tissue weight. Data represent the mean ± SEM of at least 10 animals per group. Total content of UCP1 (C) and PGC-1α (D) were determined by Western blot densitometry, taking into account the amount of total BAT protein. Data represent the mean ± SEM of at least four animals per group. Energy expenditure (E) and locomotor activity (F) was measured with an indirect open circuit calorimeter in Wt and Tg mice fed chow or an HFD for 15 weeks. Data were taken during the light and dark cycles and represent the mean ± SEM of at least eight animals per group. G: Body temperature was measured in awake animals using an intrarectal probe. Data represent the mean ± SEM of at least 10 animals per group. *P < 0.05 vs. Wt HFD. $P < 0.05 vs. Wt chow. $$P < 0.01 vs. Wt chow. ^P < 0.05 vs. Tg chow. ^^P < 0.01 vs. Tg chow. (A high-quality digital representation of this figure is available in the online issue.)

