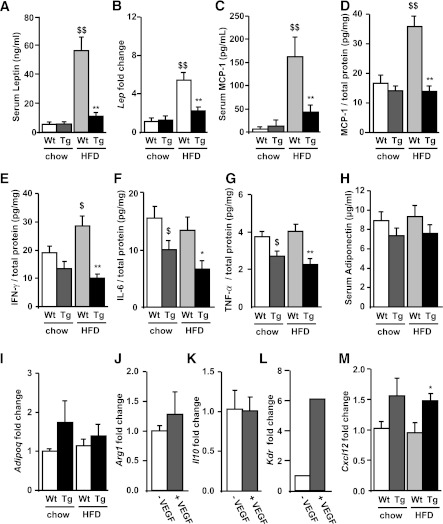
FIG. 8.
Effects of VEGF on macrophage phenotype in transgenic (Tg) and wild-type (Wt) mice. A: Serum leptin levels were determined by enzyme-linked immunosorbent assay (ELISA) as indicated in research design and methods. B: Lep expression in WAT was analyzed by quantitative real-time PCR and normalized by 36B4 expression. C: Serum MCP-1 levels were determined by ELISA as indicated in research design and methods. D: Protein MCP-1 levels in WAT were analyzed by Luminex and calculated as MCP-1 per total protein. WAT IFN-γ (E), IL-6 (F), and TNF-α (G) levels were determined by Luminex, as indicated in research design and methods, and results were calculated per total protein. H: Serum adiponectin levels were determined by radioimmunoassay, as indicated in research design and methods. I: Adipoq expression in WAT was analyzed by quantitative real-time PCR and normalized by 36B4 expression. BMDMs of Wt mice were treated with or without VEGF and Arg1 (J), Il10 (K), and Kdr (L) expression levels were determined by quantitative real-time PCR and normalized by 36B4 expression. M:WAT Cxcl12 expression was analyzed by quantitative real-time PCR and normalized by 36B4 expression. Data represent the mean ± SEM of at least 10 animals per group. *P < 0.05 vs. Wt HFD. **P < 0.01 vs. Wt HFD. $P < 0.05 vs. Wt chow. $$P < 0.01 vs. Wt chow.

