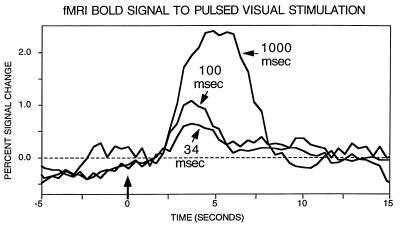
Figure 2.
Data from Robert Savoy and Kathleen O’Craven (25). BOLD contrast signal change are shown for visual stimuli of various brief durations. The three curves represent signal change for 34 msec, 100 msec, and 1,000 msec of stimuli, respectively. Importantly, clear signal change can be observed for events lasting as briefly as 34 msec.

