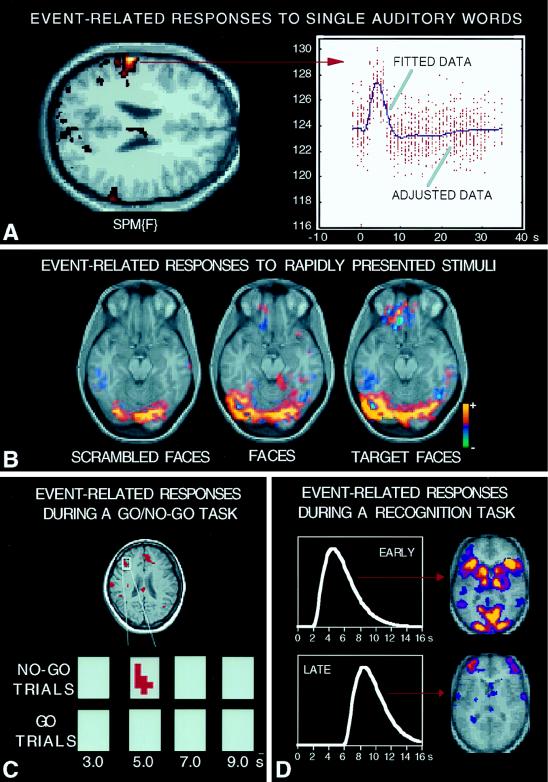
Figure 4.
Examples of applications for event-related fMRI procedures are shown from several different laboratories. (A) Provided by Karl Friston (Wellcome Department of Neurology). A statistical activation map (horizontal section through the brain) of a subject hearing single auditory words is shown on the left with individual trial data from one activated voxel shown on the right (labeled adjusted data). The data are fit with a modeled hemodynamic response function (labeled fitted data), which shows a clear increase in relation to the trial onset. (B) Adapted from Clark et al. (43). Statistical activation maps are shown for three different stimuli types (scrambled faces, faces, and a target face that subjects are matching to a learned template). These stimuli were presented randomly in rapid succession, just a few seconds separating their onsets (see text). Methods based on statistical regression were used to separate the contributions of each stimulus type and generate statistical activation maps. (C) Adapted from Konishi et al. (40). An activation map showing a right prefrontal area active in no-go trials (no-go vs. go trials) of a response inhibition task. Pixels significantly activated 5 sec after no-go stimulus presentation are coded red. The area containing no-go dominant brain activity foci are enlarged, and the brain activity at several time points after the stimulus onset is shown for no-go trials (upper panels) and go trials (lower panels). (D) Adapted from Schacter et al. (49). Brain areas activated by averaged individual trials of a recognition task (see text) are shown based on two separate hemodynamic models with varied delays. Most areas are active at a relatively short delay of about 4–6 sec to peak. However, anterior prefrontal regions were active with a delay of about 8–9 sec.

