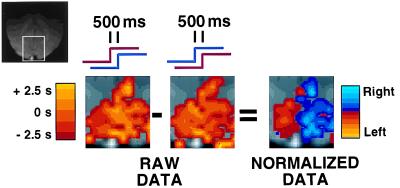
Figure 5.
Figure provided by Robert Savoy, Peter Bandettini, and Kathleen O’Craven (Massachusetts General Hospital). Activation within a region of visual cortex is shown for two separate conditions. In one condition (Left), the right visual hemifield stimulation proceeds the left by 500 msec. In the other condition (Middle), the left proceeds the right by 500 msec. Images from both of these conditions show signal changes with peaks spanning a considerable range in time (several seconds as indicated by scale on left). This intrinsic variance is too large to appreciate the 500-msec offset. However, once the data are normalized for this intrinsic variance by directly comparing the hemodynamic response from the two different lags within individual voxels, the offset between left and right hemifield stimulation can be appreciated (Right). Although not an explicit comparison across regions of brain, such a finding suggests that normalization of the hemodynamic lag within regions can allow small temporal offsets to be appreciated. These normalized offsets then can be compared across regions to make inferences about neuronal delay.

