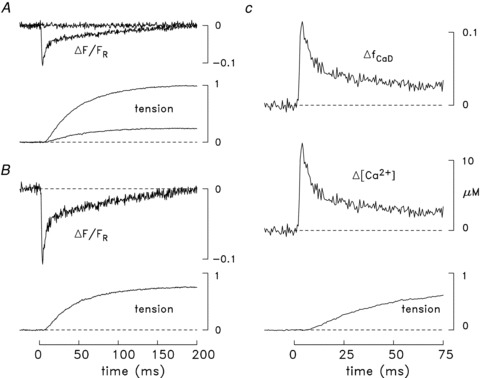
Figure 2. Ca2+ and tension transients elicited by an action potential in a soleus bundle that contained one fibre injected with furaptra.

In all panels, zero time denotes the moment the bundle was stimulated by an external shock. A, the traces labelled ΔF/FR are the fluorescence responses to sub- and supra-threshold stimuli for eliciting an all-or-none ΔF response from the injected fibre. The other pair of traces shows the sub- and supra-threshold tension responses from the bundle. The time of half-rise, time of peak and FDHM of the sub-threshold tension response are 42, 180 and 617 ms, respectively; the corresponding values for the supra-threshold response are 37, 189 and 827 ms. B, difference fluorescence and tension records obtained from the corresponding pairs of traces in A. Because the sub-threshold ΔF/FR trace was virtually flat, it was heavily smoothed prior to subtraction from the supra-threshold ΔF/FR trace, thereby avoiding an unnecessary increase in the noise level of the difference ΔF/FR trace. Peak ΔF/FR is –0.106. C, the ΔfCaD and ΔµCa2+½ traces were calculated from the ΔF/FR trace in B with eqns (1) and (2); these traces, along with the tension trace from B, are shown displayed on a faster time base. The time of half-rise, time of peak, and FDHM of ΔfCaD are 2.6, 3.5 and 8.8 ms, respectively; the corresponding values for ΔµCa2+½ are 2.6, 3.5 and 7.3 ms. Peak ΔfCaD and peak ΔµCa2+½ are 0.113 and 12.2 μm, respectively. In all panels, the tension traces are shown relative to the maximum change elicited by the supra-threshold stimulus in A. The supra-threshold ΔF/FR signal is an averaged response of 14 single sweeps, measured 11–27 min after injection. Fibre 042911.1; sarcomere spacing, 3.6 μm; 16°C.
