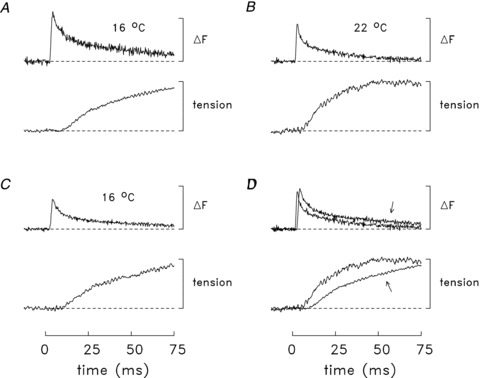
Figure 3. Fluorescence and tension transients elicited by an action potential in a soleus bundle that contained one fibre injected with mag-fluo-4.

In all panels, the traces are difference fluorescence and tension records of the type shown in Fig. 2B. The sub-threshold ΔF responses (not shown) were not detectably different from baseline. The measurements were made at 16°C (A), then at 22°C (B) and finally at 16°C (C). The times of half-rise, time of peak, and FDHM of the ΔF responses are: 3.0, 4.0 and 9.5 ms (A), 2.2, 3.0 and 4.8 ms (B) and 3.4, 4.5 and 7.3 ms (C). The corresponding values for the tension responses are: 33, 171 and 760 ms (A), 18, 66 and 319 ms (B), and 36, 167 and 841 ms (C). The calibration bar for the ΔF traces is 20 arbitrary fluorescence units. In each panel, the tension traces are shown relative to their maximum value during the twitch. In D, the faster trace in each pair is a redisplay of the corresponding trace in B; the slower trace (arrowed) is the average of the corresponding traces in A and C. In A, B and C, the ΔF traces are averages of 4, 11 and 12 sweeps, respectively; the times of the measurements were 46–54, 58–65 and 68–87 min after injection, respectively. Fibre 063011.1; sarcomere spacing, 3.9 μm; fibre diameter, 28 μm.
