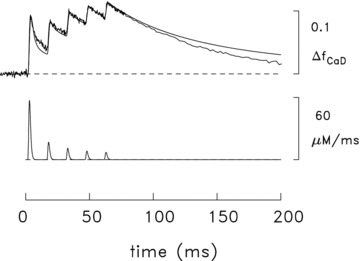
Figure 9. Measured and simulated spatially averaged waveforms in mouse slow-twitch fibres stimulated by five action potentials at 67 Hz (16°C).

The noise-free traces are simulated traces of the type described in Fig. 7. The simulated amounts of SR Ca2+ release with the five action potentials are 106, 31, 21, 15 and 13 μm, respectively. The trace with noise is an averaged ΔF signal measured in three experiments, one with furaptra and two with mag-fluo-4; the amplitude of the waveform has been referred to ΔfCaD measured with furaptra. In the furaptra experiment (fibre 062597.1), the measured ΔF/FR signal was converted to ΔfCaD with eqn (1). In one of the mag-fluo-4 experiments (fibre 063011.1), the measured fluorescence signal was indirectly calibrated in units of furaptra ΔfCaD as described in connection with Fig. 5B; in the other mag-fluo-4 experiment (fibre 062811.1), the signal amplitude was scaled so that peak ΔfCaD would be 0.091 in response to the first action potential, which is the average value determined for this peak in the other two experiments. The noise level in the measured trace changes at t≍ 78 ms due to a data-compression (averaging) routine in the data-taking program.
