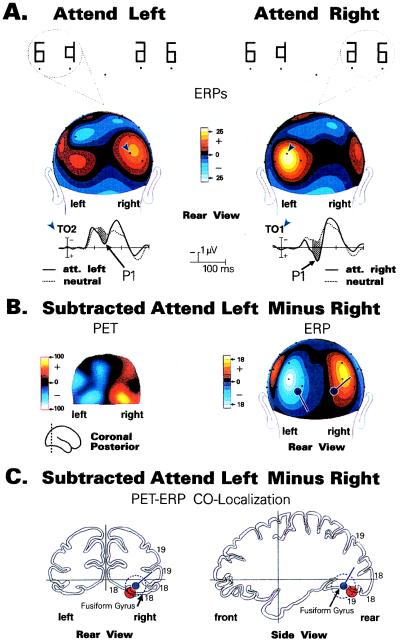
Figure 2.
(A) ERP waveforms and associated scalp current distributions of the P1 component (80–130 ms) in a spatial attention task (7) in which subjects attended to either the right or left halves of flashed symbol arrays (Top). Spatial attention increased the P1 amplitude over the occipital scalp contralateral to the attended hemifield in relation to a neutral (passive) condition. (B) Comparison of PET activation foci during the same task (in a separate session) with the positions of model dipoles calculated (using BESA) to best fit the P1 attention effect. To eliminate any effects of general arousal, difference images were formed by subtracting the attend-right from the attend-left condition. The dipoles in the right and left hemispheres have opposite polarities due to their being calculated from the subtracted (attend-left minus attend-right) scalp distributions. (C) Anatomical localizations of the best-fit P1 dipole and center of PET activation (red circle) mapped onto brain sections from the Talairach and Tournoux (44) atlas. For simplicity, only right hemisphere data are shown. Dashed circle surrounding dipole indicates the zone where changes in dipole position had minimal (<2%) effects on residual model variance. The center of PET activation in the posterior fusiform gyrus is included within the range of error of the P1 dipole.

