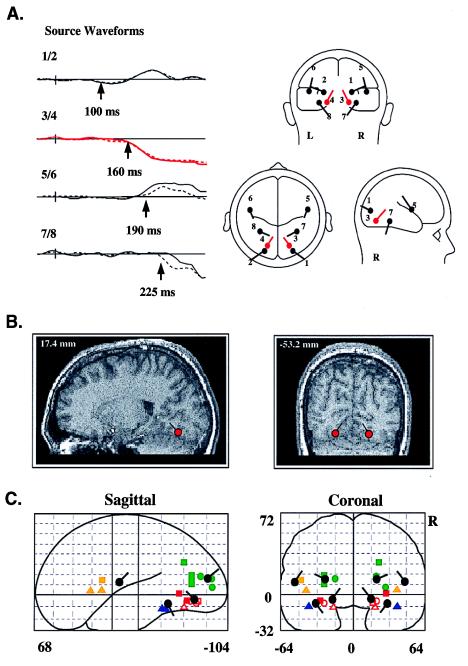
Figure 4.
(A) Set of dipoles (Right) and source waveforms (Left) in the best-fit BESA model of the attention-related ERP difference components shown in Fig. 3. Dipolar sources were constrained to be mirror-symmetrical in location across the hemispheres (left hemisphere, solid line; right hemisphere, dashed line). Note that dipoles 1 and 2 provided a best fit to the PD130 component, with activity beginning at 100 ms. The principal SN dipoles (3 and 4) and source waveforms are shown in red. The remaining dipoles account for subsequent, overlapping phases of the SN–SP complex, with onset times as indicated for each dipole pair. (B) Examples of how calculated dipole locations were coregistered with anatomical MRI sections. In this instance, dipoles 3 and 4 were localized to the fusiform gyrus of the occipital cortex. (C) Projections of mean dipole positions in the coordinate system of the Talairach and Tournoux (44) atlas, superimposed upon coordinates of PET or fMRI activations in previous studies of color-selective processing [solid squares, Corbetta et al. (17); outlined squares, Clark et al. (56); solid circles, Gulyas et al. (57); solid triangles, Martin et al. (58); outlined circles, Zeki et al. (59); outlined triangles, Sakai et al. (60)]. Activations shown in green lie close to dipoles 1 and 2; in red, to dipoles 3 and 4; in orange, to dipoles 5 and 6; and, in blue, to dipoles 7 and 8.

