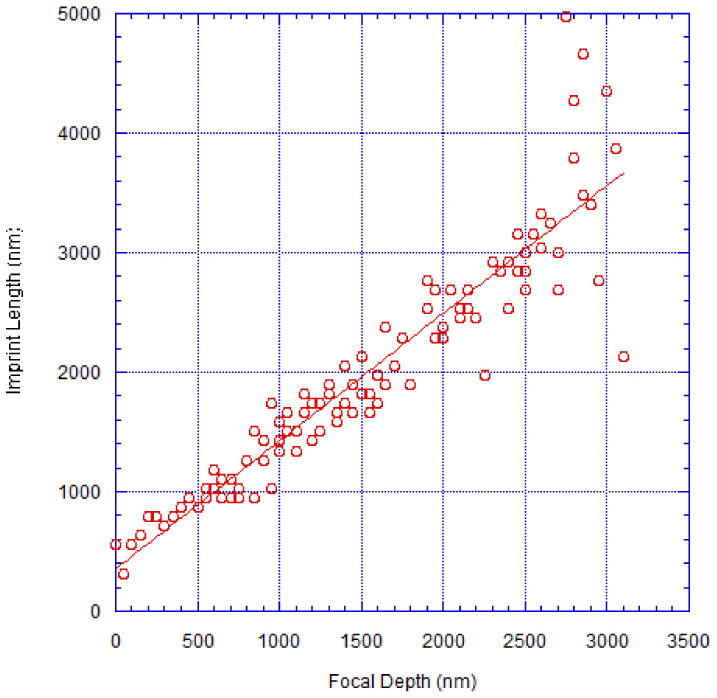
Fig. 3.

Back side machining sample measurements showing imprint length vs. focal depth, as measured from Fig. 2. The least-squares regression line is plotted on the figure as a solid line. The slope of this line is 1.07 ± 0.04. Because the precise location of the focus is difficult to determine with nanometer precision, the zero depth corresponds to the first observation of damage on the replica.
