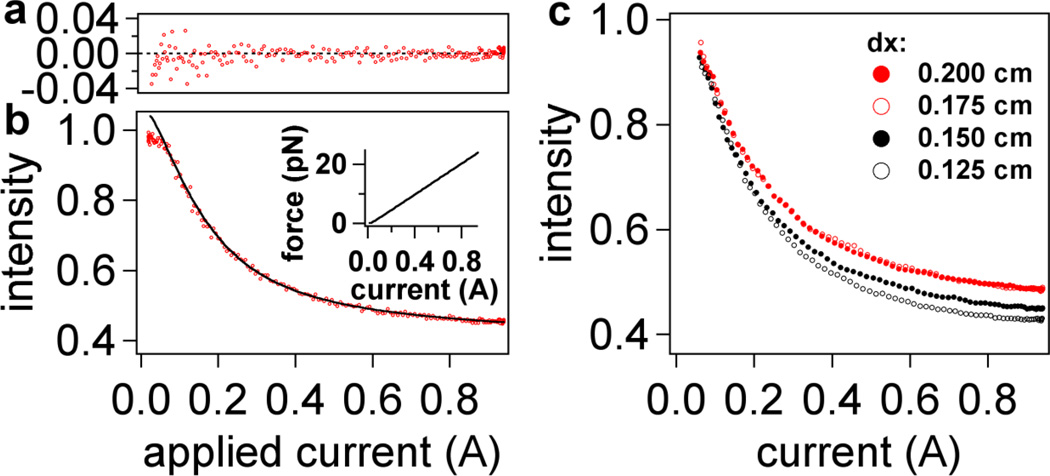
Figure 5.
Intensity-current data from retraction measurements fitted to Eq. (6) in text. (a) Plot of residuals for two intensity-current curves (raw data) indicating a noise level of less than 2% over all fits at high forces (i > 0.1 A). (b) The raw data (red) for two retraction curves; the black line is a fit from averaged data (not shown). Aside from normalization of each curve to its maximum intensity, no further modification was performed to align the data. Inset: expected variation of force with current based on Eq. 4 and experimental data for magnetic field shown in Figure 2a and 2b. (c) Averaged retraction data for four different dx laser positions (corresponding to different penetration depths). For clarity, the normalization in (c) is based on the fits to Eq. 4, resulting in an Io value corresponding to the position of the surface (i.e. a value of I = 1 corresponds to z = 0 nm). Four retraction intensity-current curves were averaged for each laser position dx and then fitted to Equation (5). The standard deviation at each point is smaller than the size of the markers (<1% of the actual intensity value). Fitting results from this data set and others are listed in Table 1.

