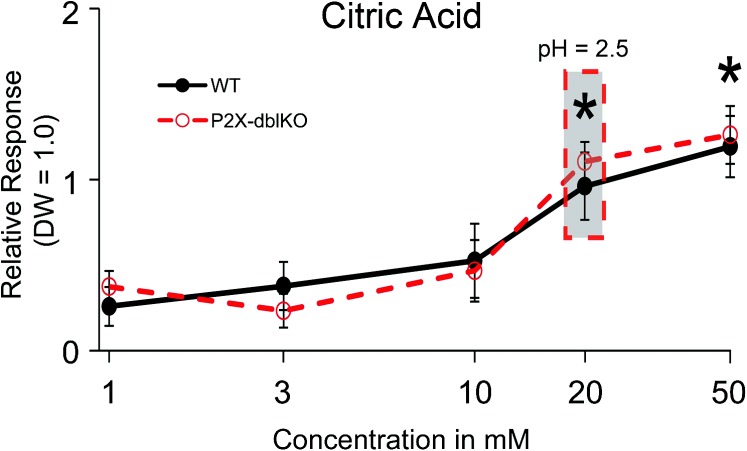
Figure 6.
Relative responses of the SL nerve in WT (solid lines and filled circles) and P2X-dblKO (dotted lines and open circles) mice to different concentrations of citric acid dissolved in 150 mM saline. Responses are normalized to DW which evokes a substantial response in the SL nerve. The gray box highlights the lowest concentration that evokes a statistically significant response in both WT and P2X-dblKO mice; the corresponding pH values are given for reference. Values indicated are expressed as mean ± SE. Number of subjects are 6–16 for WT mice and 7 for KO mice. *P < 0.05; Tukey’s post hoc.

