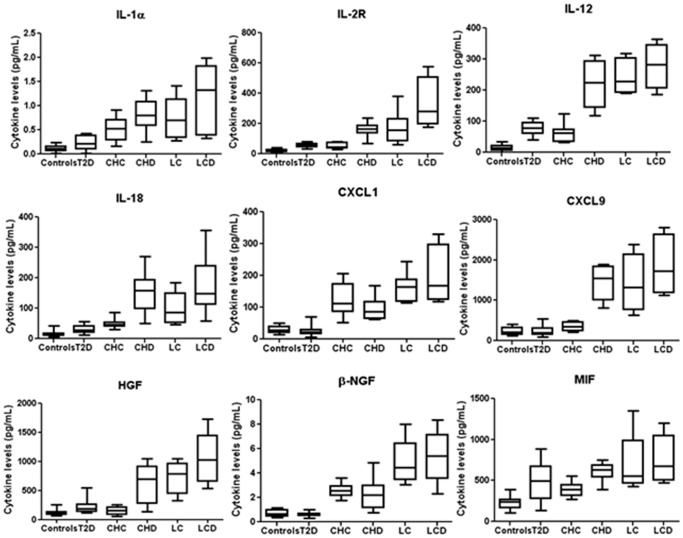
Figure 1. Significant cytokines in some patient groups.
We report the significant molecule levels from controls and patients with type 2 diabetes (T2D), chronic hepatitis C (CHC), CHC-related cirrhosis (LC), CHC hepatitis and type 2 diabetes (CHD) and CHC-related cirrhosis and type 2 diabetes (LCD), evaluated by 21-Plex panel, are plotted with box-and-whisker graphs. The boxes extend from the 25th to the 75th percentile, and the line in the middle is the median. The error bars extend down to the lowest value and up to the highest.

