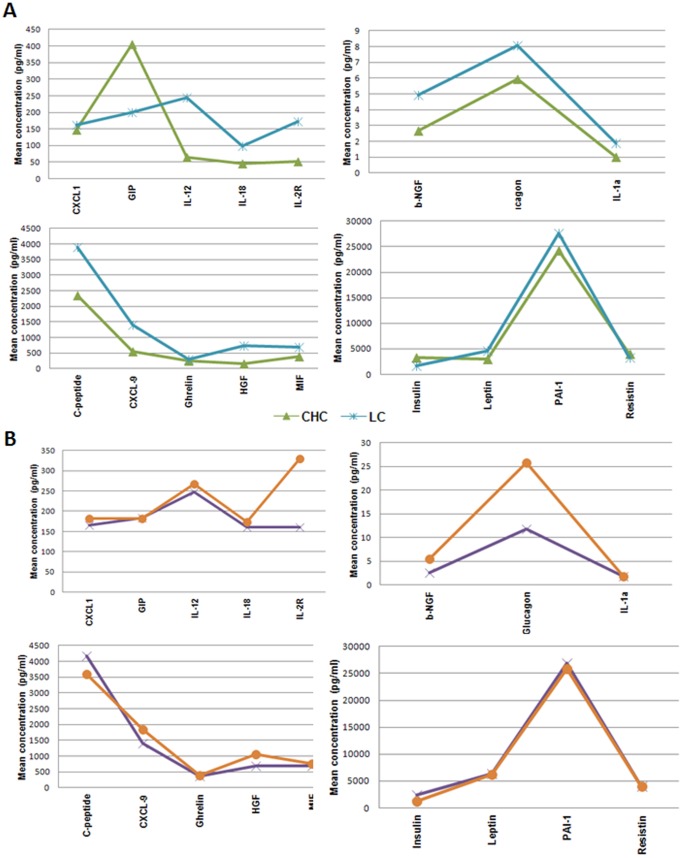
Figure 3. Mean concentrations of significant cytokines.
We report the mean levels of the molecules evaluated in patients with chronic hepatitis C (CHC) and CHC-related cirrhosis (LC) (A), and with CHC hepatitis and type 2 diabetes (CHD) and CHC-related cirrhosis and type 2 diabetes (LCD) (B). The legends evidence the different colors used for the analyzed groups.

