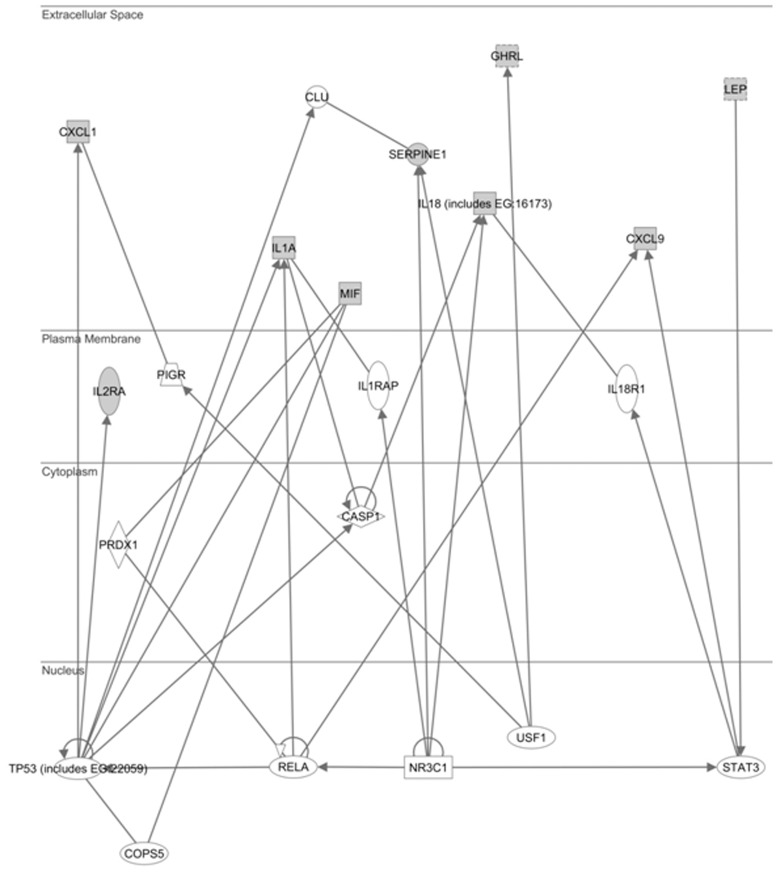
Figure 4. Ingenuity Pathway Analysis (IPA) of significant molecules.
The graph shows the closely associated network for significant cytokines, reported also in Table 2, (evidenced with grey symbols) and other molecules (evidenced with white symbols) obtained by IPA software.

