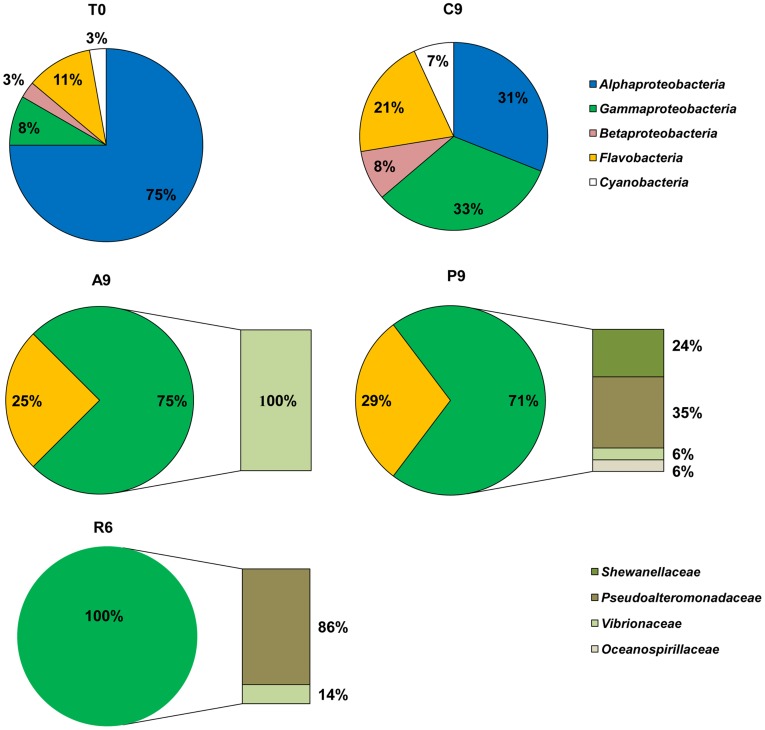
Figure 4. The distribution of phyla in each 16S rRNA library (% of clones) from different treatments.
DNA extraction from the sample at the beginning of the experiment (T0), on day 9 from the control (C9), on day 9 from the treatment with Aurelia (A9) and treatment with Pelagia (P9), and on day 6 from the treatment with Rhizostoma (R6).

