
Figure 3. Incremental cost-effectiveness scatter plot and cost effectiveness acceptability curves of platinum-based chemotherapy plus cetuximab versus platinum-based chemotherapy alone.
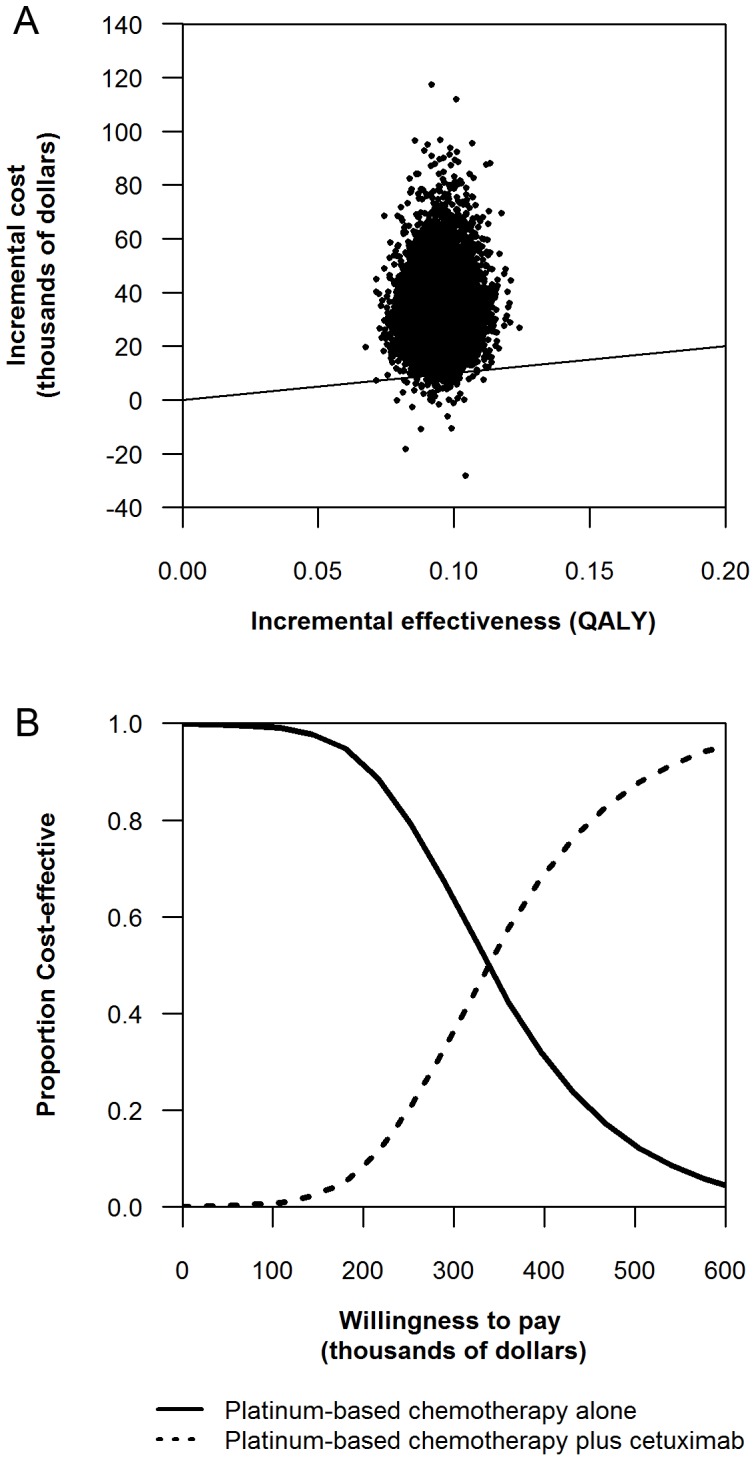
Each graph was based on 10000 replicates. 3a Incremental cost-effectiveness scatter plots. 3b Cost effectiveness acceptability curves.