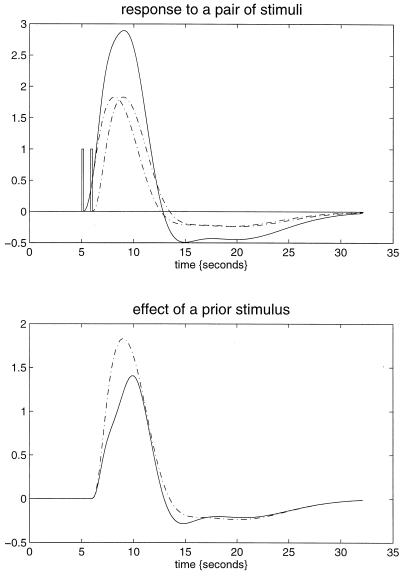
Figure 3.
(Upper) The simulated responses to a pair of words (bars) (1 sec apart) presented together (solid line) and in isolation (broken lines) based on the second-order hemodynamic response function in Fig. 1. (Lower) The response to the second word when preceded by the first (broken line), obtained by subtracting the response to the first word from the response to both, and when presented alone (broken). The difference reflects the impact of the first word on the response to the second.

