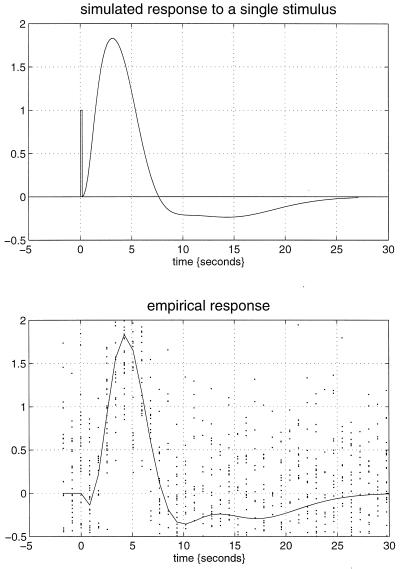
Figure 4.
(Upper) Hemodynamic response to a single word (bar at 0 sec) modeled by using the Volterra kernel estimates of Fig. 1. (Lower) The empirical event-related response in the same region based on an independent, event-related, single-subject fMRI experiment. The solid line is the fitted response using only first-order kernel estimates, and the dots represent the adjusted responses.

