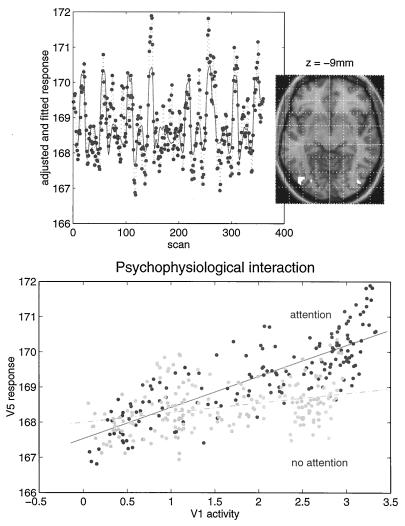
Figure 6.
(Upper) SPM thresholded at P = 0.001 (height uncorrected) and P = 0.05 (volume corrected) superimposed on a structural T1-weighted image. This SPM tests for a significant psychophysiological interaction between activity in V1/V2 and attention to visual motion. The most significant effects are seen in the vicinity of V5 (white region, lower right). The time series of the most significant (Z = 4.46) voxel in this region is shown in the Upper panel (line, fitted data; dots, adjusted data). (Lower) Regression of V5 activity (at 42, −78, and −9 mm) on V1/V2 activity when the subject was asked to attend to changes in the speed of radially moving dots and when the subject was not asked to. The lines correspond to the regression. The dots correspond to the observed data adjusted for confounds other than the main effects of V1/V2 activity (dark grey dots, attention; light grey dots, no attention). Attention can be seen to augment the influence of V1/V2 on V5.

