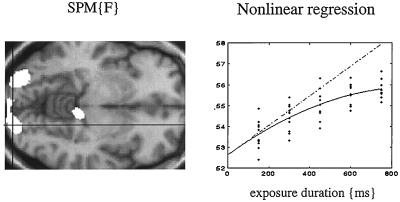
Figure 8.
(Left) SPM(F) testing for the significance of a second-order polynomial regression of activity on the duration of visually presented words as measured in five normal subjects by using PET. Bilateral extrastriate regions are shown as white regions surviving a threshold of P = 0.05 (uncorrected) on a structural T1-weighted MRI. (Right) An example of this regression for the voxel under the cross-hairs on the left. It can be seen that the observed response function deviates from the linear relationship that would be expected if the amount of neural activity evoked was proportional to the duration over which it was elicited.

