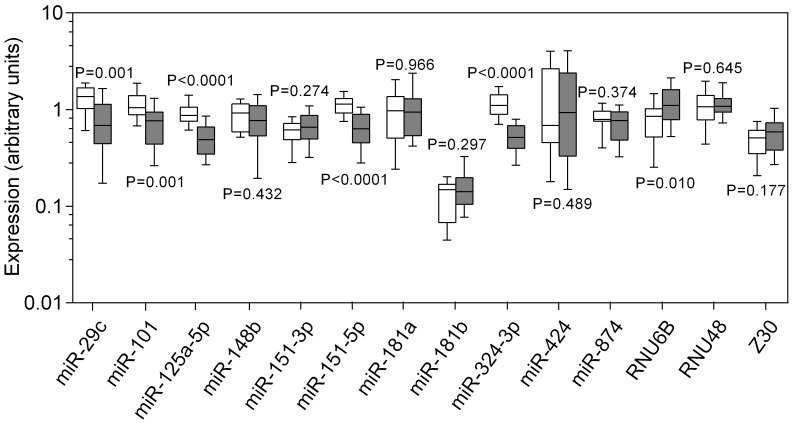
Figure 1. Expression of candidate reference genes in human nonmalignant and malignant bladder tissue samples.
RT-qPCR analyses were performed from 17 nonmalignant bladder tissue samples and 41 samples from low-grade and high-grade papillary urothelial carcinoma. Expression levels of the candidate reference genes are given as arbitrary units. Boxes (blank, nonmalignant samples; black, malignant samples) represent lower and upper quartiles with median as horizontal line; whiskers depict the 10 and 90 percentiles. Significances are illustrated as P values of the Mann-Whitney U test.

