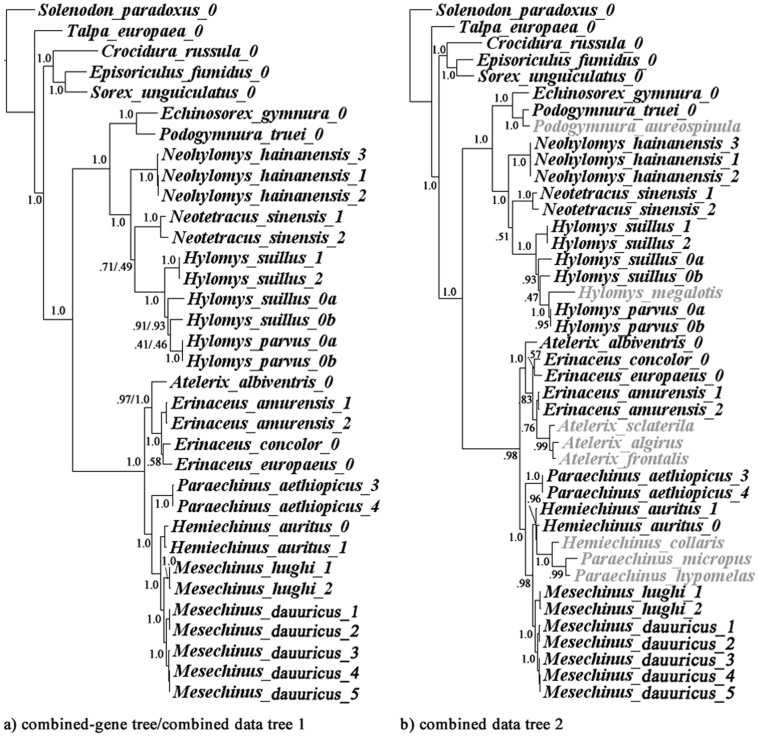
Figure 7. Combined-data phylogeny.
Result of Bayesian phylogenetic analyses using combined genes or genes-morphology combined data set including 14 erinaceids species (a) and 22 species (b). Node numbers indicate Bayesian posterior probabilities. Only one value is presented if the posterior probabilities are identical. Taxa shaded in grey have no available gene sequences in this study.

