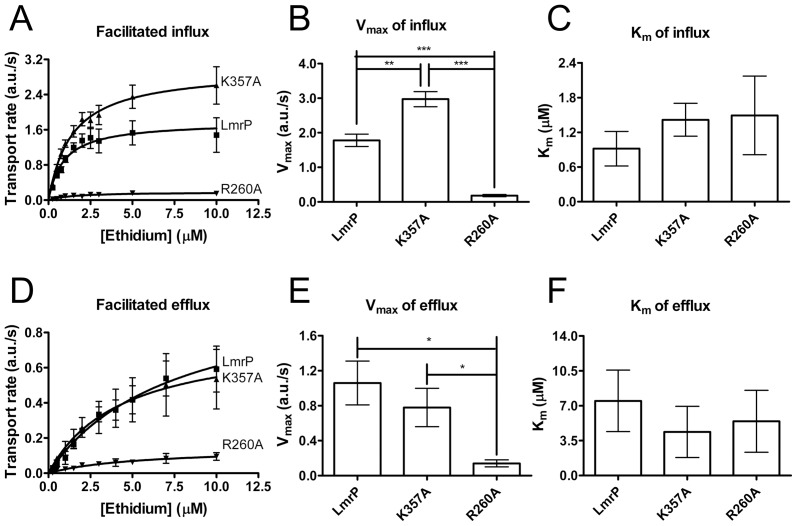
Figure 6. Kinetic analysis of LmrP-mediated, facilitated ethidium influx and efflux.
A, The ethidium influx rates in ATP-depleted cells were measured as a function of the ethidium concentration. Each data point represents the mean ± SEM of four independent experiments (n = 4). B, Comparison of Vmax of the K357A or R260A mutant with that of Wt LmrP. The data were analysed by one-way ANOVA followed by the post-hoc Tukey’s test. **P<0.01, ***P<0.001, both significantly different. C, Comparison of Km for ethidium of the K357A or R260A mutant with that of Wt LmrP. Analysis by one-way ANOVA shows that Km values are not significantly different. D, The efflux rates in ATP-depleted cells were measured as a function of the ethidium concentration. Each data point represents the mean ± SEM of three independent experiments (n = 3). E, Comparison of Vmax of K357A or R260A mutant with that of Wt LmrP. The data were analysed by one-way ANOVA followed by the post-hoc Tukey’s test. *P<0.05, significantly different. F, Comparison of Km of the K357A or R260A mutant with that of Wt LmrP. Km values were not significantly different when the data were analysed by one-way ANOVA.

