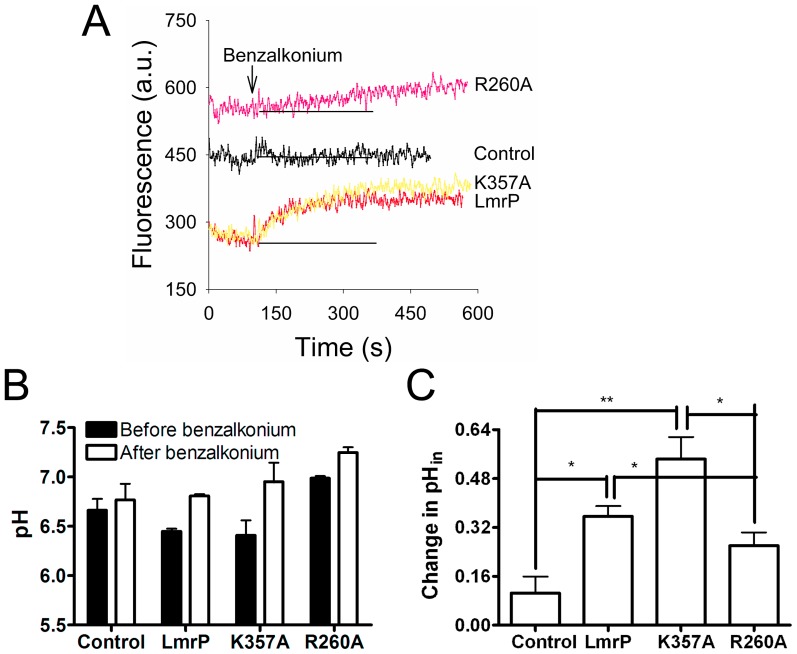
Figure 7. Determination of change in CFSE fluorescence and pHin in intact cells during facilitated benzalkonium influx.
A, ATP-depleted cells containing Wt LmrP, LmrP mutants (R260A or K357A) or no LmrP protein (Control) were preloaded with 30 µM CFDASE ester, which is intracellulary covalently bound as CFSE, and diluted to a final A660 value of 0.5 in 2 ml of 50 mM KPi/5 mM MgSO4 at pH 7.0. After the CFSE fluorescence measurement was started, 44.1 µM benzalkonium chloride was added at the time indicated by the arrow. Base line in grey is added to facilitate comparison of the initial slopes (see main text). B, The pHin values in cells before and after the addition of the benzalkonium were derived from fluorescence calibration curves (not shown). All values represent the mean ± SEM of three independent experiments (n = 3). C, The changes in pHin were analysed using the one-way ANOVA followed by the post-hoc Tukey’s test. *P<0.05, **P<0.01, significantly different. All values represent the mean ± SEM of three independent experiments (n = 3).

