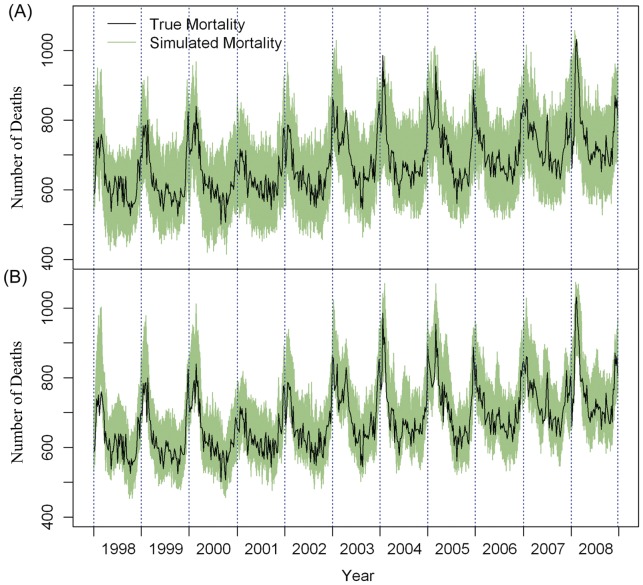
Figure 1. Weekly observed all-cause mortality (black line) and simulated mortality data (green lines).
Data were generated (A) under the assumption of low seasonal variation with the degree of freedom for trend set at 1 per year, or (B) under the assumption of high seasonal variation with the degrees of freedom for trend set at 10 per year.

