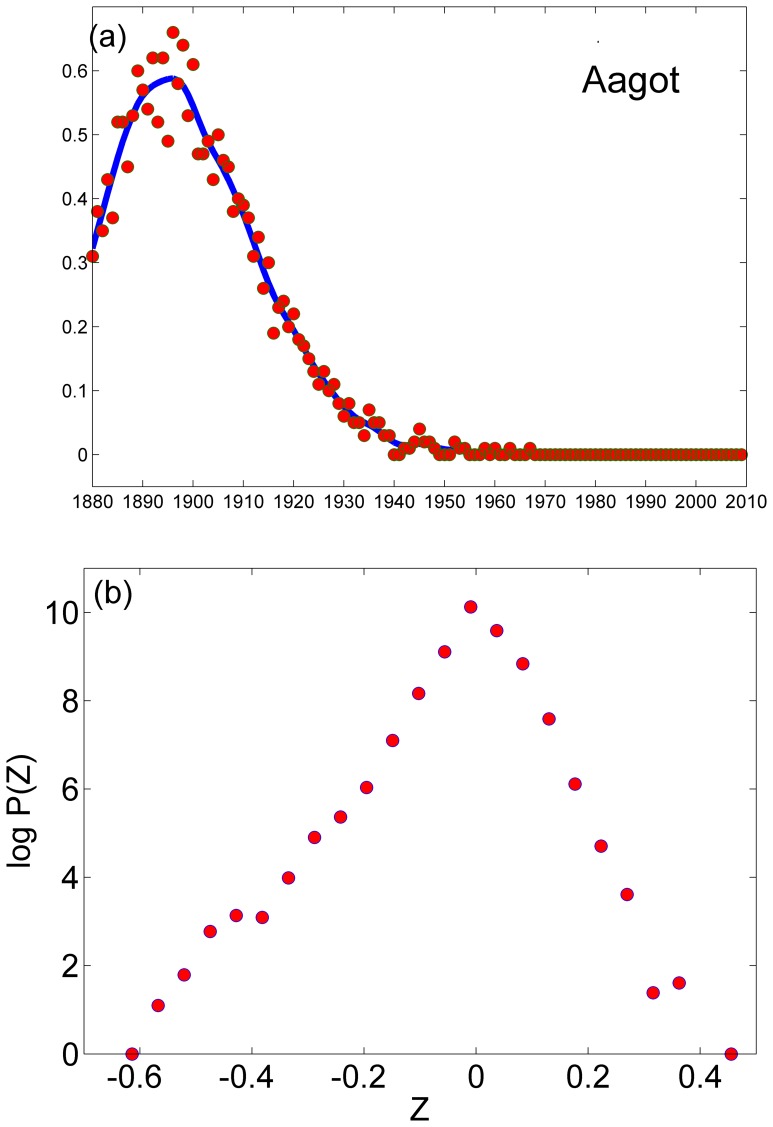
Figure 4. Quantifying stochasticity: the deterministic part of the dynamics was extracted from the timeseries associated with a given name using MATLAB’s smoothing algorithm, as shown in panel (a) for the first name in the girls’ list, Aagot.
The distance from the real data (point) to the “prediction” of the deterministic dynamics (line), was then extracted for any year at each time series. After appropriate normalization for demographic noise [Eq. (2)] a histogram for the log of the deviations is shown in panel (b). The distribution of Z falls, more or less, exponentially with a width which is much smaller than unity.

