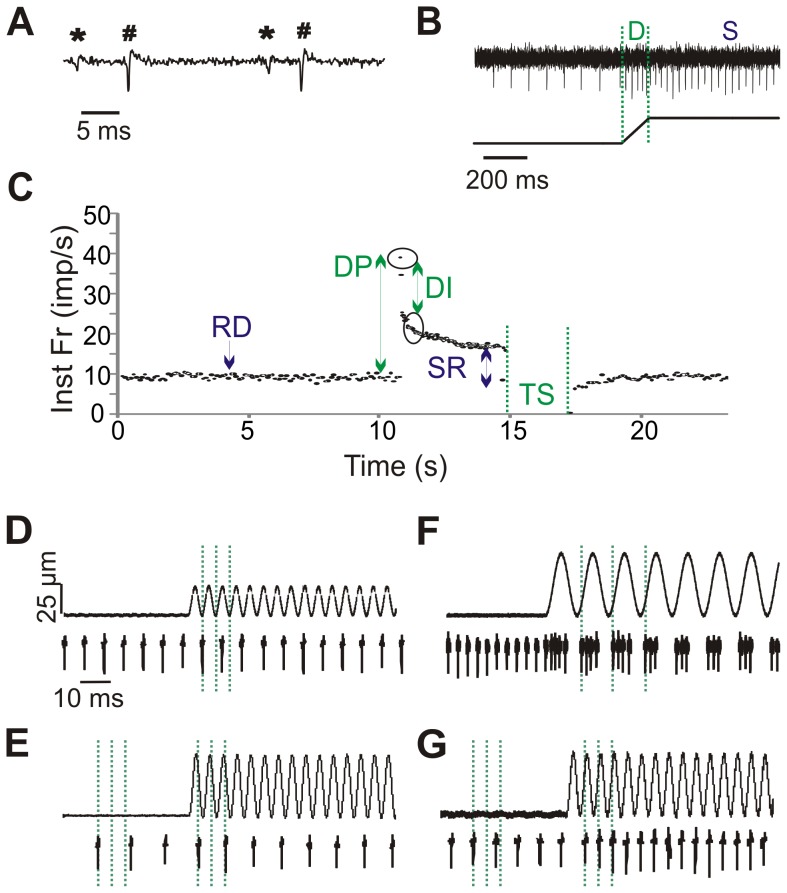
Figure 1. Data analysis methods.
A. Raw waveform of 2 representative units (* and #). Spike2 software was used to identify unique waveforms based on shape. B. Response of 1 representative unit to ramp-and-hold stretch (length change of muscle shown below). The dynamic phase (D) of the stretch occurs during the ramp when the muscle is changing length. The static phase (S) of the stretch encompasses the time in which the length is held constant. C. Instantaneous frequency (Inst Fr) response to stretch of one unit. Arrows indicate time points where resting discharge (RD), dynamic peak (DP), dynamic index (DI), static response (SR), and time silenced (TS) are calculated. D-G: Afferent responses to vibration. D. No change in firing to a 25 Hz vibration. E. Entrainment at a subharmonic of 1:2 to a 25 Hz vibration. F. Multiple spikes per cycle at 10 Hz vibration. G. 1:1 entrainment at 25 Hz.

