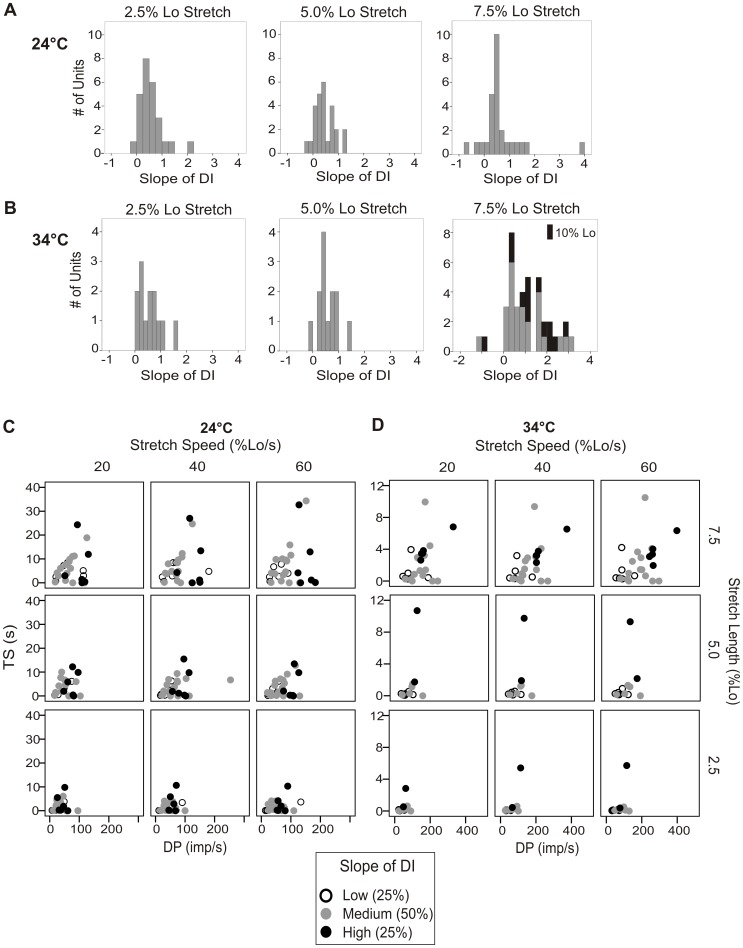
Figure 3. Spindle afferents could not be definitively classified using measures of dynamic sensitivity.
A and B. The slope of the linear regression of DI over the 3 stretch speeds tested was calculated at all 3 stretch lengths and shown for 24°C (A) and 34°C (B). No bimodal distribution was observed, though there was the largest variation in response at the largest stretch length. The response of a subset of the animals (n = 13) to a larger stretch length at 34°C (10% Lo) is shown stacked in black associated with values obtained at 7.5% Lo. No additional separation was observed at even this extreme length. The DP vs. TS responses of the 25% of the units with the highest (open circles), middle 50% (gray circles), and bottom 25% (black circles) slopes of DI are plotted at 24°C (C) and 34°C (D).

