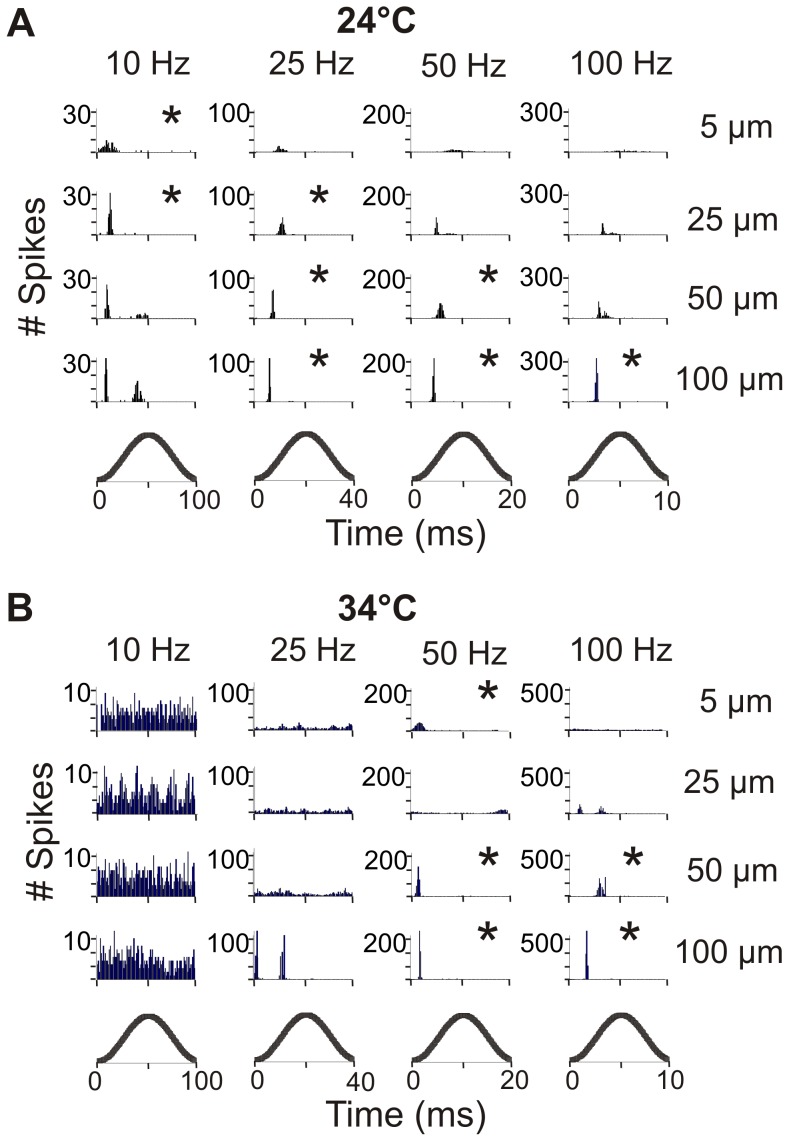
Figure 5. Response to vibration of one unit at 24°C and 34°C.
Number of spikes at a given time over the vibration cycle for all 16 vibrations at 24°C (A) and 34°C (B). Bottom traces show the stage of vibration cycle. Amplitude of vibration increases down the column and frequency increases left to right. * denotes 1:1 entrainment of the unit.

