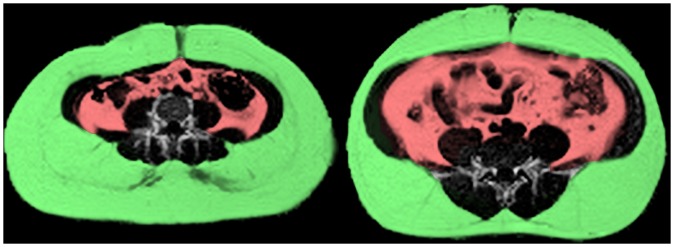
Figure 1. Fat/water ratio images for two participants with the same BMI of 33.
Subcutaneous fat is highlighted in green and visceral fat is highlighted in red. Visceral adiposity differs substantially between the two participants (4% on left, 11% on right). This illustrates the advantage of direct fat quantification over surrogate measures of adiposity such as BMI.

