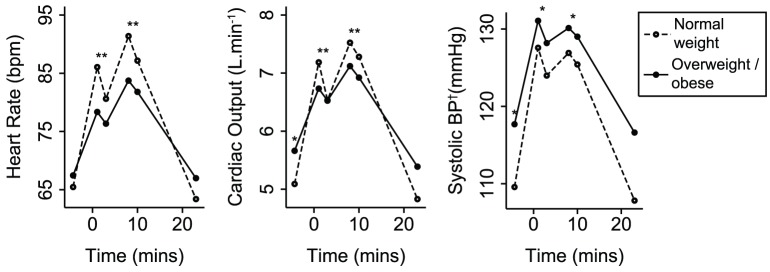
Figure 4. Mean cardiovascular response to stress, comparing overweight/obese and normal weight participants.
Three key response variables are shown. Random-effects generalised least squares regression was used to assess differences. * P<0.01, ** P<0.0001. At rest, P-values show the significance of the difference between groups. During stress, P-values refer to comparisons of the response to stress with respect to rest. Values during recovery did not differ significantly from resting values. †Blood pressure.

