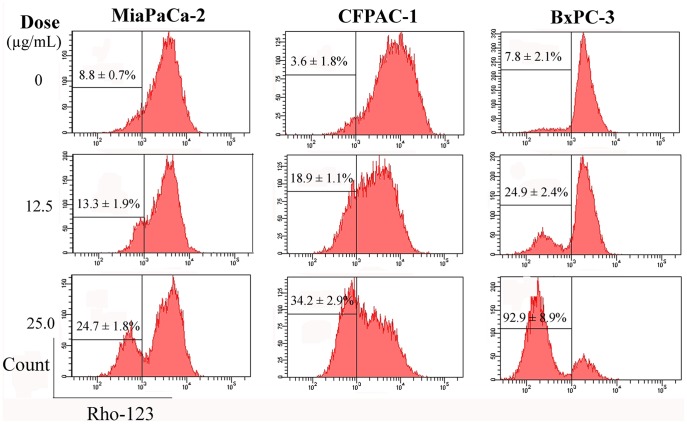
Figure 8. Analysis of the loss of ΔΨm.
The cells (5×10⁴ cells/well in 24-well plate) were treated at the indicated doses for 48 h. Then the experiments were subject to FCM. Representative results from three independent experiments are shown; and each value represents mean ± SD in three independent experiments.

