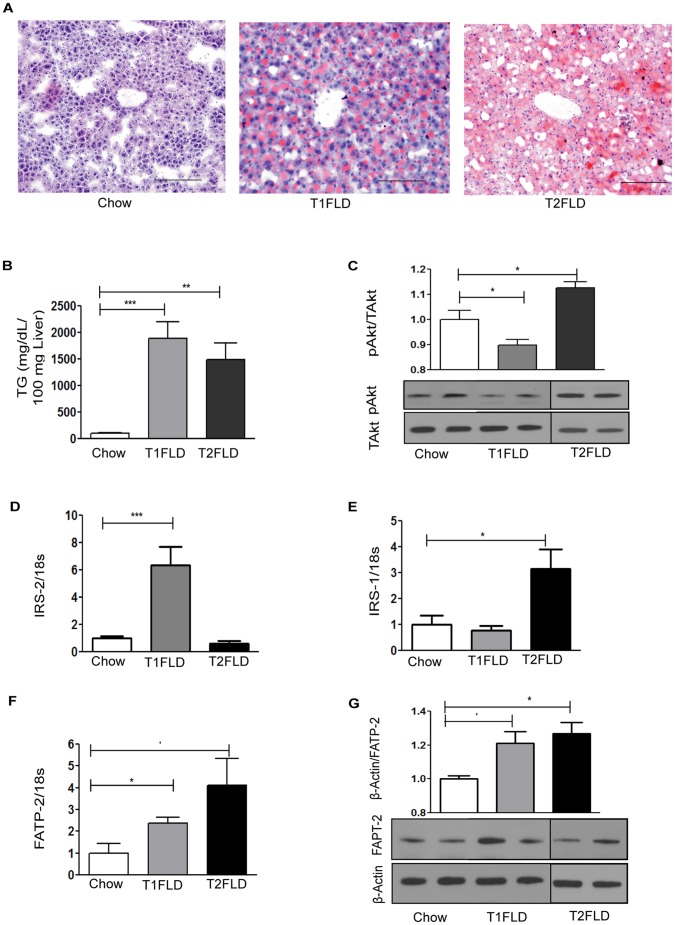
Figure 2. In vivo models of hypoinsulinemia on HFD (T1FLD) and hyperinsulinemia on HFD (T2FLD) lead to fatty liver disease.
(A) Oil red-O staining (red) of representative liver sections scale bar = 100 µm of chow fed(Chow), mice fed HFD for 2 weeks and then streptozotocin injected for three days (T1FLD) and HFD fed mice for 12 weeks (T2FLD). (B) TG content per 100 mg of liver tissue in Chow, T1FLD, and T2FLD mice (C) Liver pAkt of Chow, T1FLD, and T2FLD mice (D) Liver IRS2 mRNA expression normalized to 18s ribosomal protein in Chow, T1FLD, and T2FLD, (E) Liver IRS1 mRNA expression normalized to 18s ribosomal protein in Chow, T1FLD, and T2FLD (F) Liver FATP2 mRNA expression normalized to 18s ribosomal protein in Chow, T1FLD, and T2FLD, (G) Liver FATP2 protein on Western Blot normalized to β-actin in Chow, T1FLD, and T2FLD, [One way ANOVA with Tukey’s post-hoc test *P<0.05, **P<0.01 & ***P<0.001; n = 5–8 per group, representative of three replicate experiments.]

