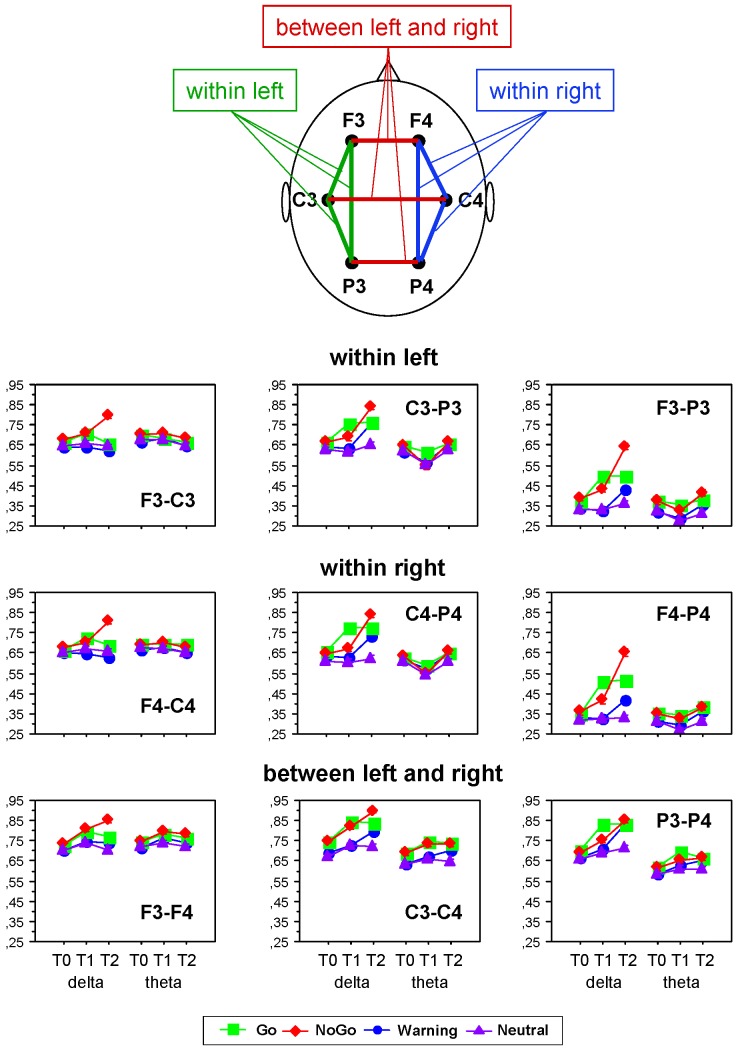
Figure 3. Phase coherence for separate electrode pairs under the different task conditions.
Phase Coherence (PC) values averaged across subjects and conditions for separate electrode pairs indicating phase coupling within the left hemisphere (F3-C3, C3-P3, and F3-P3, upper row), within the right hemisphere (F4-C4, C4-P4, and F4-P4, middle row), within the left hemisphere (F3-F4, C3-C4, and P3-P4, bottom row) are presented. The PC-values were averaged for each electrode pair within the three consecutive 300-ms time intervals (T0, T1 and T2) separately for delta and theta frequency bands. The vertical bars indicate standard errors.

