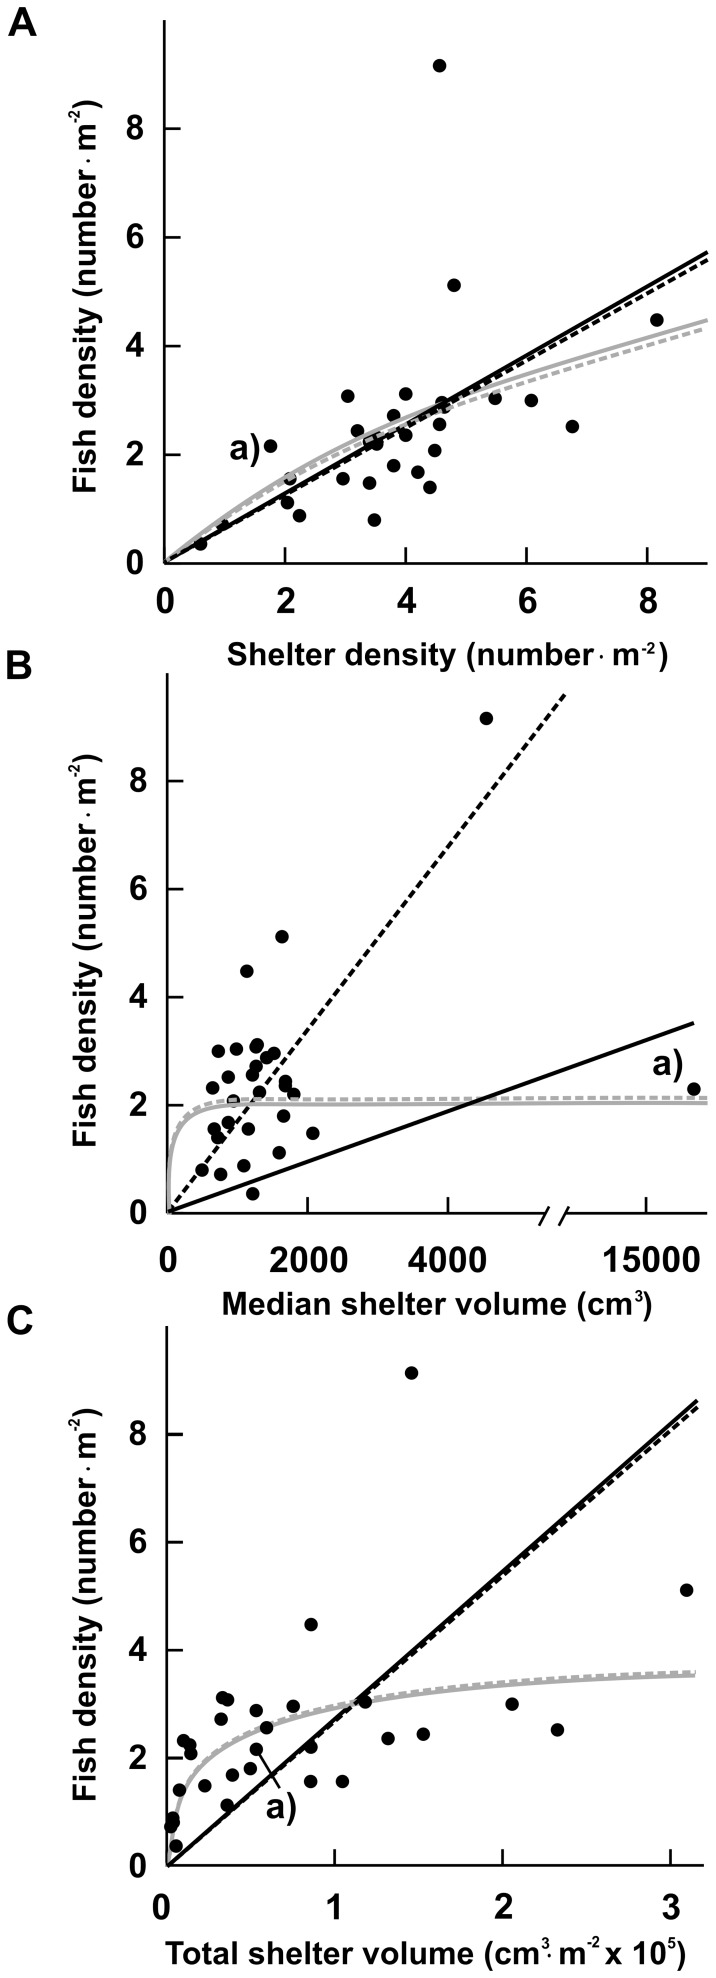
Figure 5. Relationship between fish density and shelter availability characteristics.
The relationship between fish density (number m−2) and A) shelter density (number m−2), B) median shelter volume (cm3) and C) total shelter volume (cm3⋅m−2) for the 30 quadrats sampled. The solid black line represents the best fit linear regression to the entire dataset, whereas the dashed black line represents the best fit linear regression without Quadrat 5 (point a). The solid grey line represents the best fit asymptotic curve to the entire dataset, whereas the dashed grey line represents the best fit asymptotic curve without Quadrat 5 (point a).

