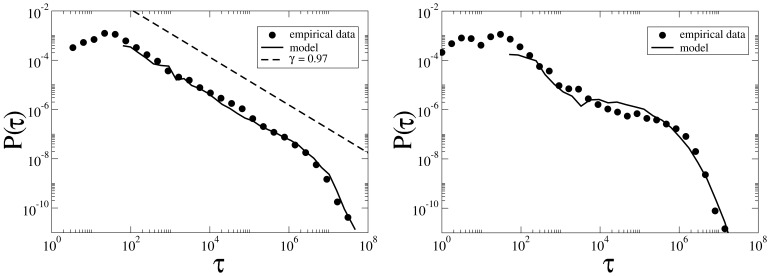
Figure 9. PDF of intervals between two successive edits on an article (in seconds) for two samples of highly/weakly disputed articles (left/right panel).
Each sample contains 20 articles and the average  for all articles is about 10 hours. Circles are empirical data and solid lines are model fit, with values
  ,
,  and
and  ,
,  respectively for disputed and non-disputed samples. The dashed line in the left panel is the power law with exponent
  .
.

