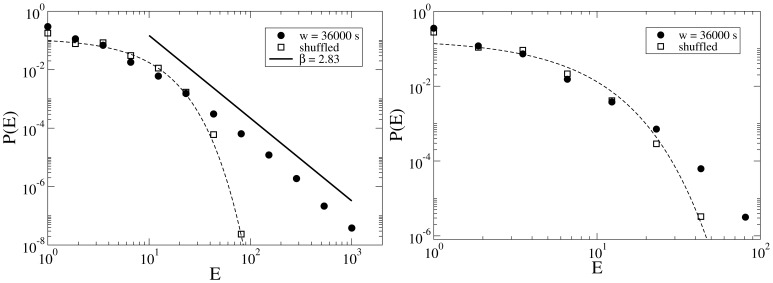
Figure 11. Distribution of  for two samples of highly/weakly disputed articles (left/right panel).
Circles are for the original sequences, whereas empty squares correspond to the shuffled sequences. Dashed lines are exponential fits to the  for shuffled data and solid line in the left panel is a power-law with
  .
.

