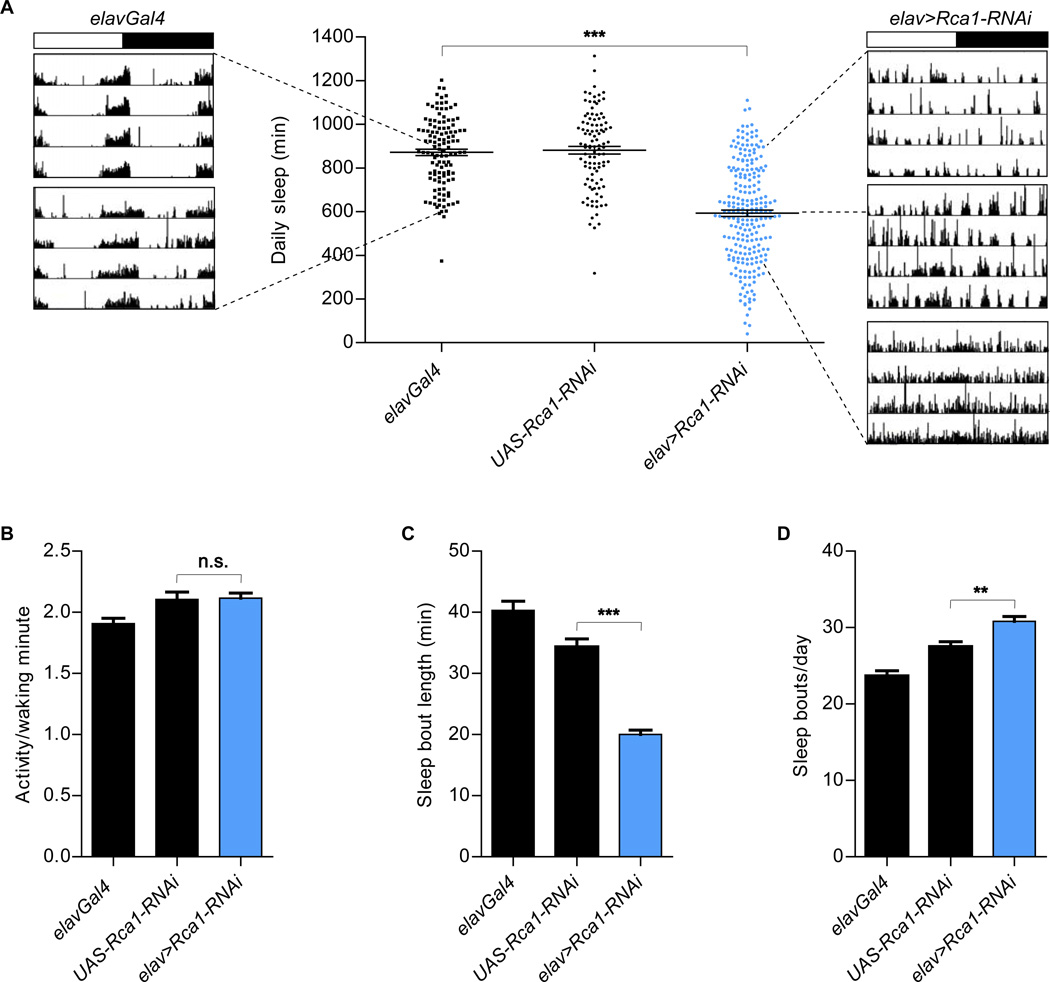
Figure 1. Reduced sleep in animals expressing neuronal Rca1-RNAi.
(A) Pan-neuronal Rca1-RNAi (elav>Rca1-RNAi, Number of animals (n) =235) reduced the duration of daily sleep compared to that of the parental control animals tested as hemizygotes [elavGal4 (n=121), UAS-Rca1-RNAi (n=103)]. Shown are example actograms for elavGal4 and elav>Rca1-RNAi flies that have average or extreme phenotypes. The top actogram for elav>Rca1-RNAi shows an example of a fly that is a “normal” sleeper (800+ minutes of sleep), but that did not show consolidation of rest and activity states (phenotype seen in 18 out 49 “normal” elav>Rca1-RNAi sleepers). Dashed lines point from the actograms to the amount of sleep seen in these individual flies. The white and black portions of the bar above the actograms indicate the light and dark periods of the experiment, respectively. (B) Comparable activity per waking minute in elav>Rca1-RNAi flies and controls. (C, D) Decreased sleep bout length (C) and increased number of daily sleep bouts (D) in elav>Rca1-RNAi flies, compared to the parental controls. Statistical analysis performed using One-way ANOVAs with Tukey post-test. Shown is statistical significance for experimental genotypes compared to controls with the most similar values. In all figures, error bars represent SEM; in all figures *P<0.05, **P <0.01, ***P<0.001. In all experiments described in this figure, elavGal4 drives the expression of UAS-Dicer2.

