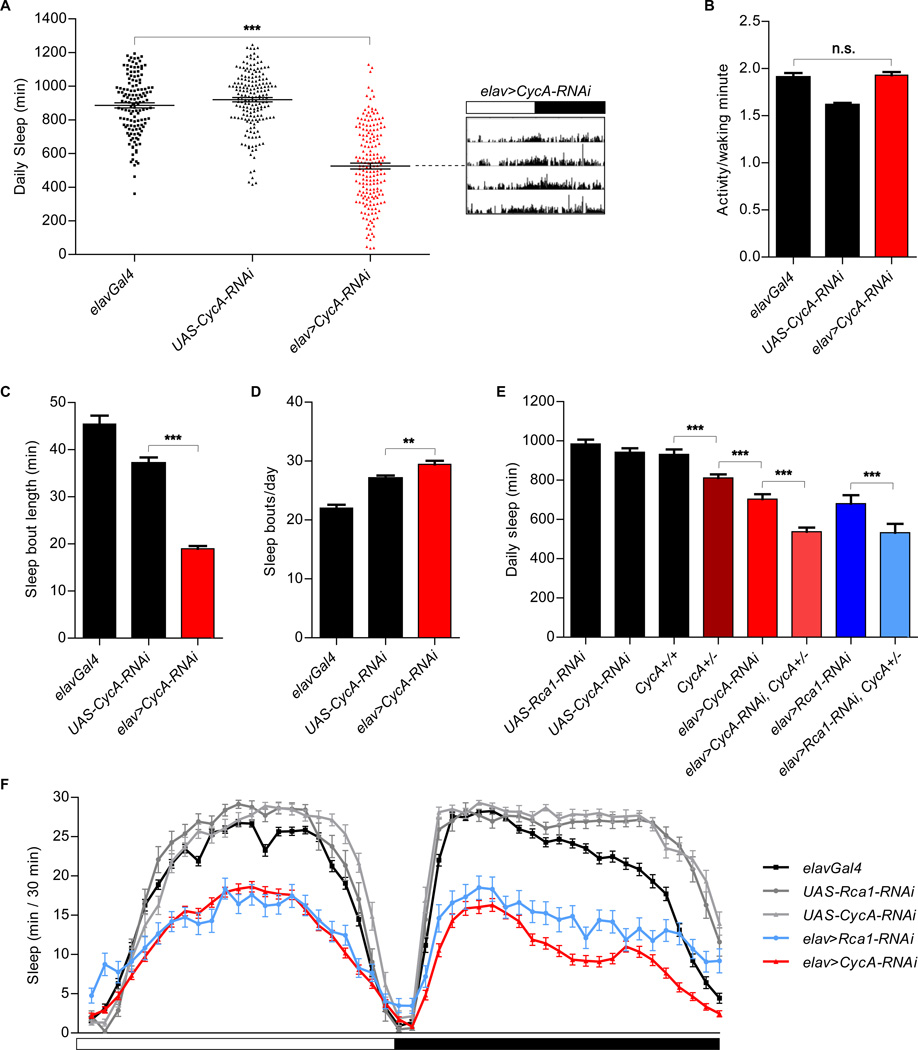
Figure 2. Reduced sleep in animals expressing neuronal CycA-RNAi.
(A) Reduced sleep in animals expressing pan-neuronal CycA-RNAi [elav>CycA-RNAi (n=185)] compared to that of the parental controls [elavGal4 (n=136), UAS-CycA-RNAi (n=178)]. Shown is an actogram of an elav>CycA-RNAi with an average phenotype. The white and black portions of the bar above the actogram indicate the light and dark periods of the experiment, respectively. (B) Normal levels of activity per waking minute in animals expressing CycA-RNAi in neurons. (C, D) Average sleep bout length was decreased (C), while the number of daily sleep bouts was increased (D), in elav>CycA-RNAi flies. (E) Shorter total sleep of CycA null heterozygous flies [CycA+/− (n=136)] than that of flies with both functional copies of the gene [CycA+/+ (n= 82)]. Introducing RNAi against either CycA or Rca1 into the CycA heterozygous background enhanced the sleep phenotypes [elav>CycA-RNAi, CycA+/− (n=99); elav>Rca1-RNAi, CycA+/− (n=35)]. Other controls shown are UAS-Rca1-RNAi (n=33), UAS-CycA-RNAi (n=56), elav>CycA-RNAi (n=78) and elav>Rca1-RNAi (n=22). (F) Sleep profile of elav>CycA-RNAi (n=126), elav>Rca1-RNAi (n=58), and control [elavGal4 (n=88), UAS-Rca1-RNAi (n=24), UAS-CycA-RNAi (n=36)] flies. Statistical analysis performed using One-way ANOVAs with Tukey post-test. In all experiments described in this figure, except that shown in panel (E), elavGal4 drives the expression of UAS-Dicer2.

