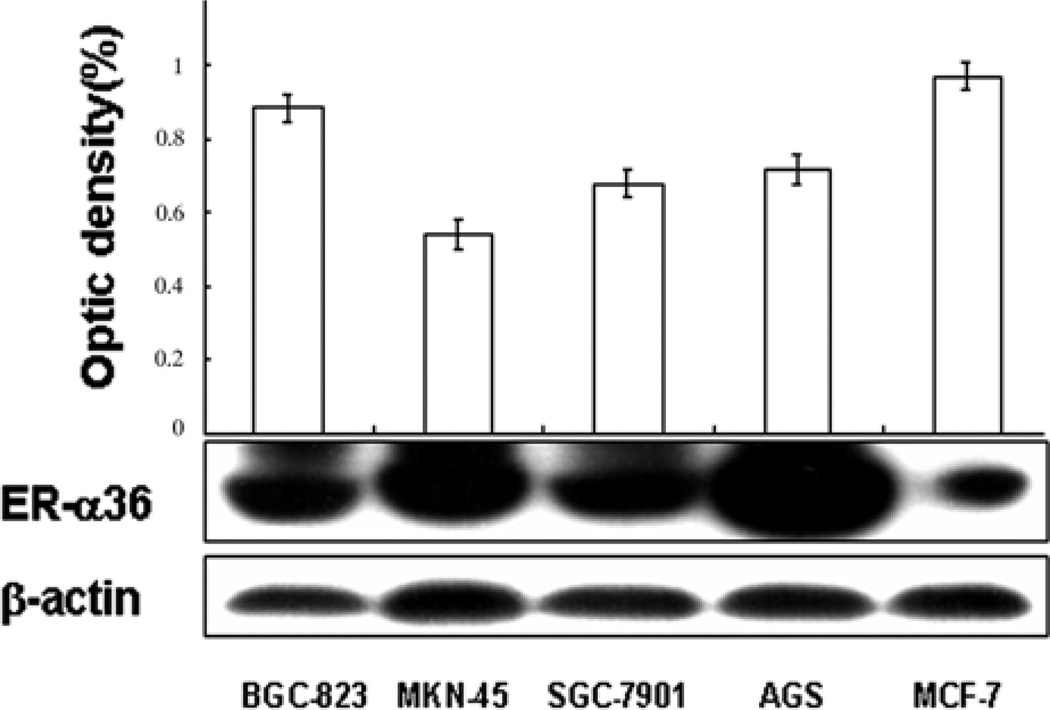
Figure 1.
Western blot analysis of ER-α36 protein expression in human gastric cancer cell lines. Expression levels of ER-α36 protein were assessed in four human gastric cancer cell lines, SGC7901, BGC823, MNN45 and AGS. ER-positive breast cancer MCF-7 cell line was used as a positive control. The levels of ER-α36 and β-actin protein expression were determined with a video-densitometry system and the band densities relative to the density of β-actin band are shown.

