
Figure 9.
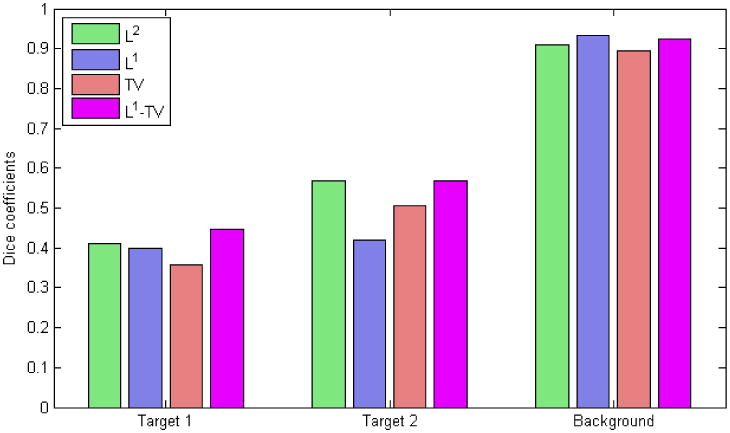
Dice coefficients representing the similarity between the CT image and the reconstructed FMT images for different penalties. Target 1 represents the line source to the right in all the subimages in figure 8 while target 2 represents the line source to the left.