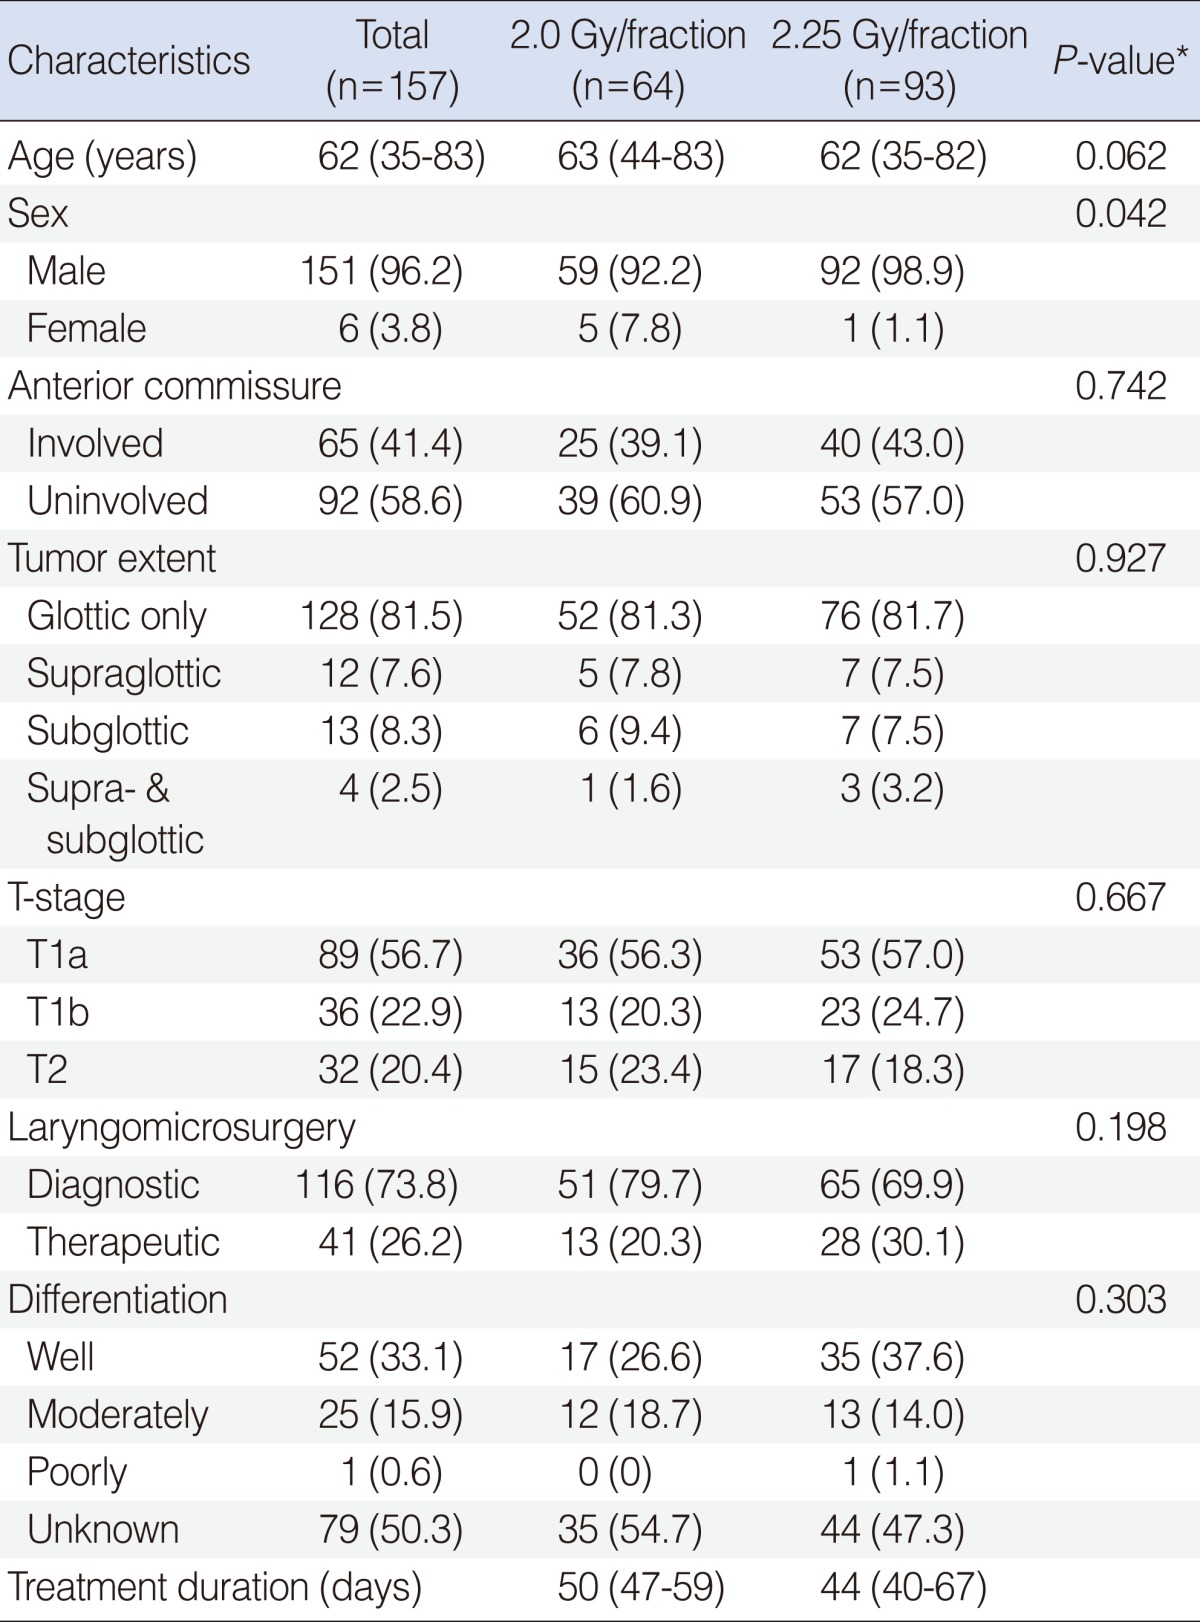
Table 1.
Patients characteristics by fraction size

Values are presented as median (range) or number (%).
*P-value by Student t-test.
Patients characteristics by fraction size

Values are presented as median (range) or number (%).
*P-value by Student t-test.