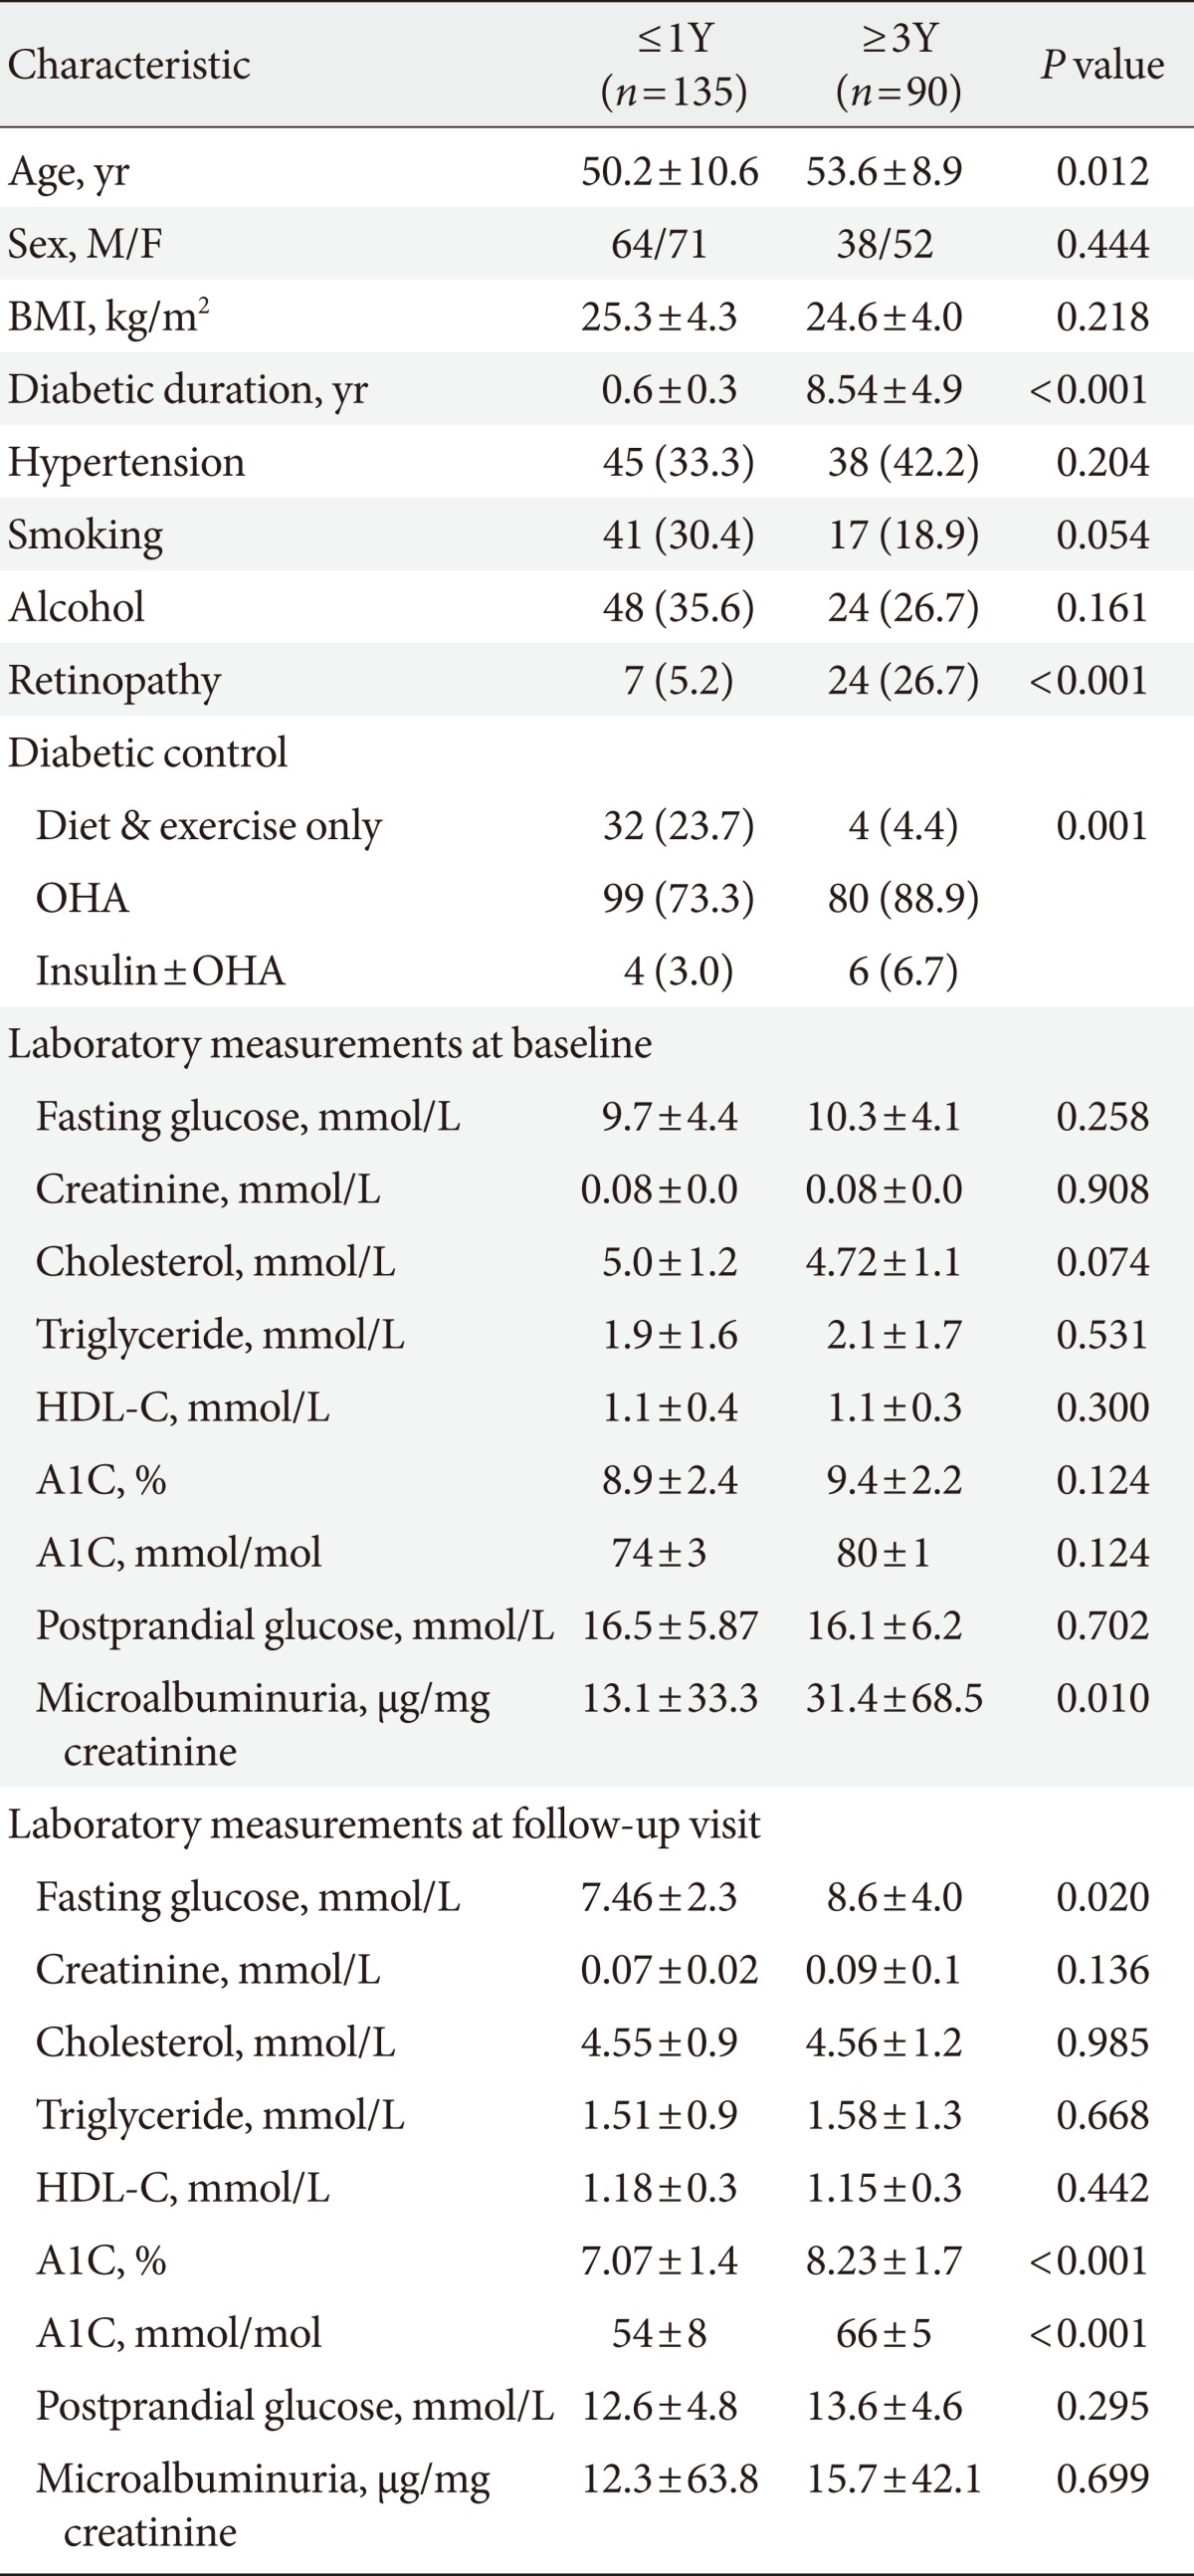
Table 2.
Baseline characteristics between groups

Values are presented as mean±standard deviation or numbers (%).
BMI, body mass index; OHA, oral hypoglycemic agent; HDL-C, high density lipoprotein cholesterol; A1C, glycated hemoglobin.
Baseline characteristics between groups

Values are presented as mean±standard deviation or numbers (%).
BMI, body mass index; OHA, oral hypoglycemic agent; HDL-C, high density lipoprotein cholesterol; A1C, glycated hemoglobin.