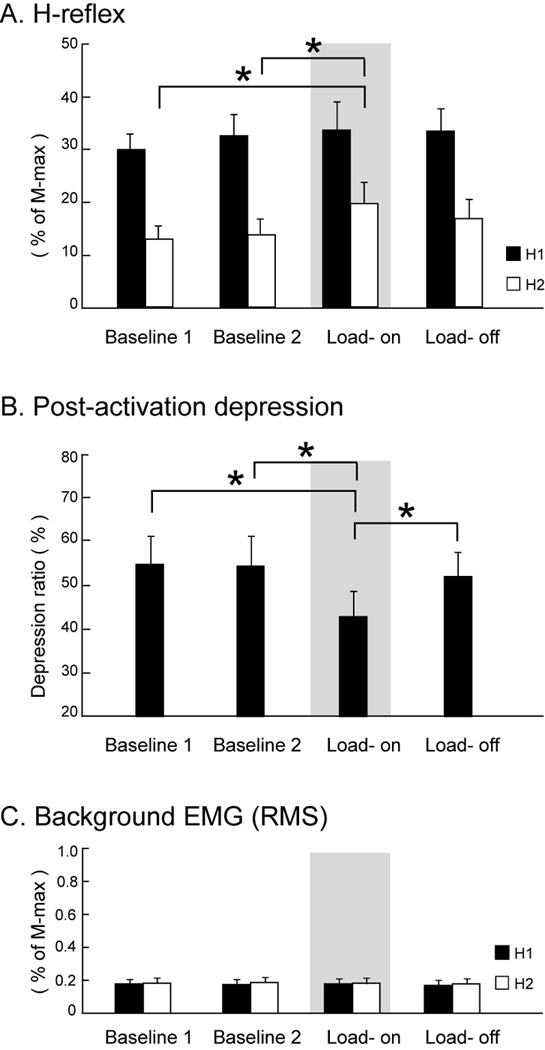
Figure 4. Experiment 1: Average H-reflexes (A), depression ratios (B), and background soleus muscle activity across different sessions (C).

Gray areas indicate the testing condition in which the compressive load equal to 50% of the individual’s body weight was applied (Load-on phase). Error bars, ± 1 SEM. Asterisks indicate significant post-hoc differences between conditions. H1: test reflex; H2: conditioned reflex; RMS: root-mean-square.
